On The Edge Of A Recession

- Markets tend to ebb and flow between risk taking and risk aversion periods. As we all know, risk taking has been quite a strong theme since June 2012. However, for a while now I’ve discussed the non-confirmation signal from the Dow Theory. I have also discussed the S&P 500’s bearish momentum divergence relative to its 200 day MA. On top of that, I’ve also covered how S&P 500’s new highs have not been confirmed by other risk correlated assets such as the Aussie Dollar / Japanese Yen. Together with the chart above of The Risk Appetite, all of these signals indicate that risk aversion is slowly creeping in.

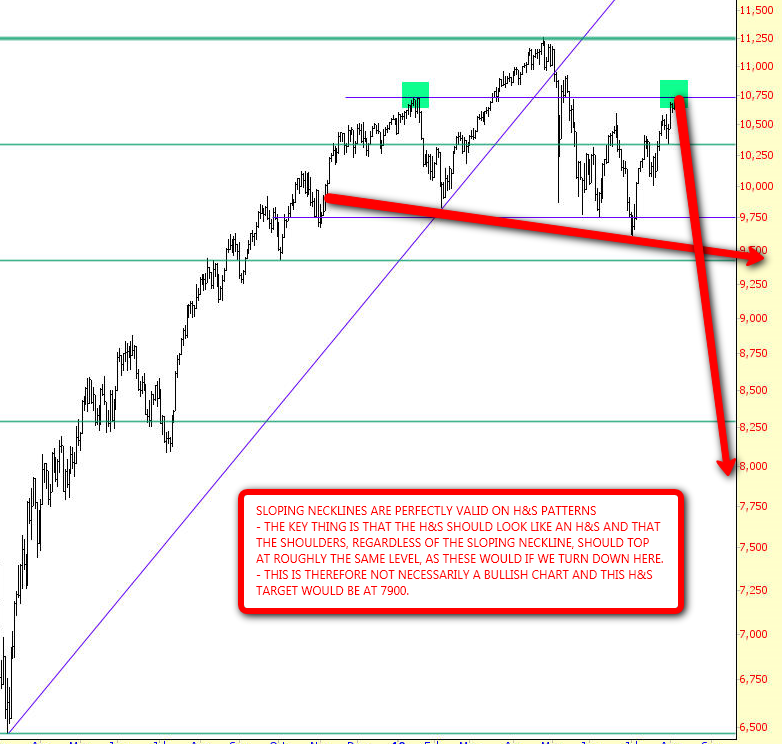
- According to various blogs and forums, the current Treasury Bond technical picture is one of a head & shoulders top. While I’m not an the world’s greatest technician, I do know that down sloping necklines hardly ever work out, just like S&P’s famous down-slopping neckline of 2010 – we all know which way the price went next. While I think Treasuries are extremely overbought, I am not ready to short them until a major fundamental catalyst triggers a reversal. As already outlined many times on this blog, Treasury Bonds tend to top during a major fundamental event like a bankruptcy or a default… and Greece is now well overdue!

- According to the latest CFTC Commitment of Trader report, which came out on Friday, hedge funds are now net long British Pound, despite continuous QE by the Bank of England as well as UK’s economy contracting for the third month in the row. Since the start of the Global Financial Crisis in 2008, whenever hedge funds have built net long exposure towards the Pound, an intermediate top was almost always nearby. Furthermore, confirming the COT report, last time I’ve update Pound’s sentiment survey we saw a lofty 62% of bullish readings. Those readings have now moved towards extreme levels of 70% bulls.

- Unlimited QE has been launched by Federal Reserve Chairman Ben “Helicopter” Bernanke. So what did everybody do? They piled into Gold via the GLD ETF. The chart above shows how GLD’s Tonne Holdings has now jumped to all time record high levels. This indicator is also confirmed by the rapid rise in Comex Gold’s Open Interest activity. Furthermore, in the mid September post I showed how PMs sentiment surveys were reaching short term extremes. From a contrarian perspective, speculative activity and hot money could now signal that a short term pullback / consolidation is on the cards. Regardless of “Unlimited QE”, I’d advise holding back from adding positions in this sector for the time being.
- Featured section in this article
- Leading Indicators section in this article
- Featured section in this article
- Leading Indicators section in this article
- Leading Indicators section in this article

Let us consider the fact that this week’s Manufacturing Durable Goods Orders collapsed, as we recorded a first year on year negative reading since the 2008/09 recession. You might remember it was only a few weeks ago that I was warning of further manufacturing weakness ahead and my view now is that we are seeing recession signals. Economist website, Markit summarises the report:
Orders for long-lasting goods fell sharply in August in the US, according to official data. Orders fell 13.2% on the previous month, a near record fall and the largest seen since the record 14.3% decline in January 2009. Orders, excluding volatile transportation goods, were down 3.3% in the three months to August compared to the prior three months, and with its forward-looking properties, suggest an ongoing deterioration in the manufacturing output trend.
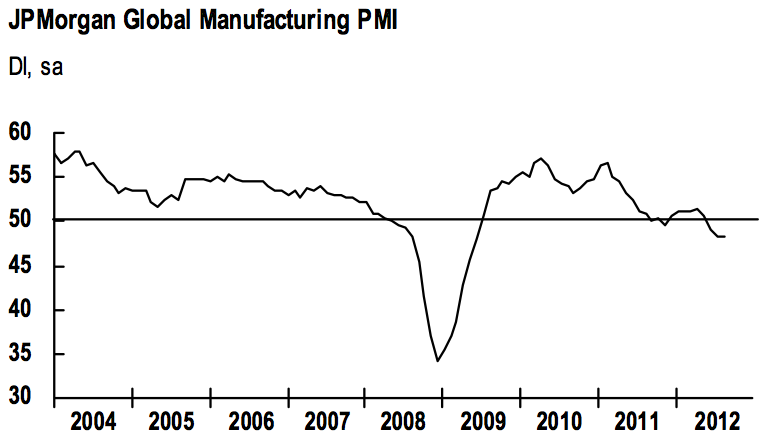
These orders data suggest that manufacturing looks set for the worst quarter for three years in the third quarter, possibly stagnating, which is similar to the downbeat message from business surveys such as the PMI.

One interesting point from the Markit summary was the fact that we saw “a near record fall and the largest seen since the record 14.3% decline in January 2009.” The chart above shows that during the current secular bear market and global de-leverging period, whenever Manufacturing Durable Goods Orders fell by more than 10%, the economy has either been in, or was about to enter a recession.

According to the Philly Fed Coincident State indicator, there are more and more US States slipping into a contraction and experiencing a slowdown. Looking at the chart above, the “breadth” of the US economy is narrowing, just like the breadth of the stock market is narrowing too. I hardly doubt that we can turn back into positive growth, when we have close to half of the US experiencing a slowdown already. In my opinion, it is only a matter of time until this reading increases and US officially enters a recession.
There has been an abundance of bulls pointing to strong Weekly Jobless Claims, decent Non Farm Payrolls data and a recovery in Housing. However, these bulls obviously do not understand how a business cycle works and it is a slump in Goods Orders that builds Inventory and eventually forces companies to pull back on Investment and increase Lay Offs. In other words, manufacturing leads employment and employment eventually creates confidence in Housing, not the other way around. At the same time, other bulls point to positive GDP as a sign that the economy is still growing. While not surprising to me, the US GDP figures were revised down to a complete stall speed of 1.25% this week. Let us remember that GDP is a lagging indicator, so we might already be close to a first quarterly contraction in Q3.


This mornings data out of Japan confirmed that, as Tankan Manufacturing Conditions fell slightly in the third quarter of 2012. Bloomberg writes:
“Big Japanese manufacturers became more pessimistic as slowdowns in China and Europe sapped export demand and pushed the nation closer to an economic contraction. The quarterly Tankan index for large manufacturers fell in September to minus 3 from minus 1, the fourth negative reading, the Bank of Japan said today in Tokyo.
‘Japan’s economy will probably have two consecutive quarters of contraction in the July-September and October- December periods,’ said Kiichi Murashima, chief economist at Citigroup Global Markets Japan Inc. ‘Exports are the main reason for the economic contraction.'”
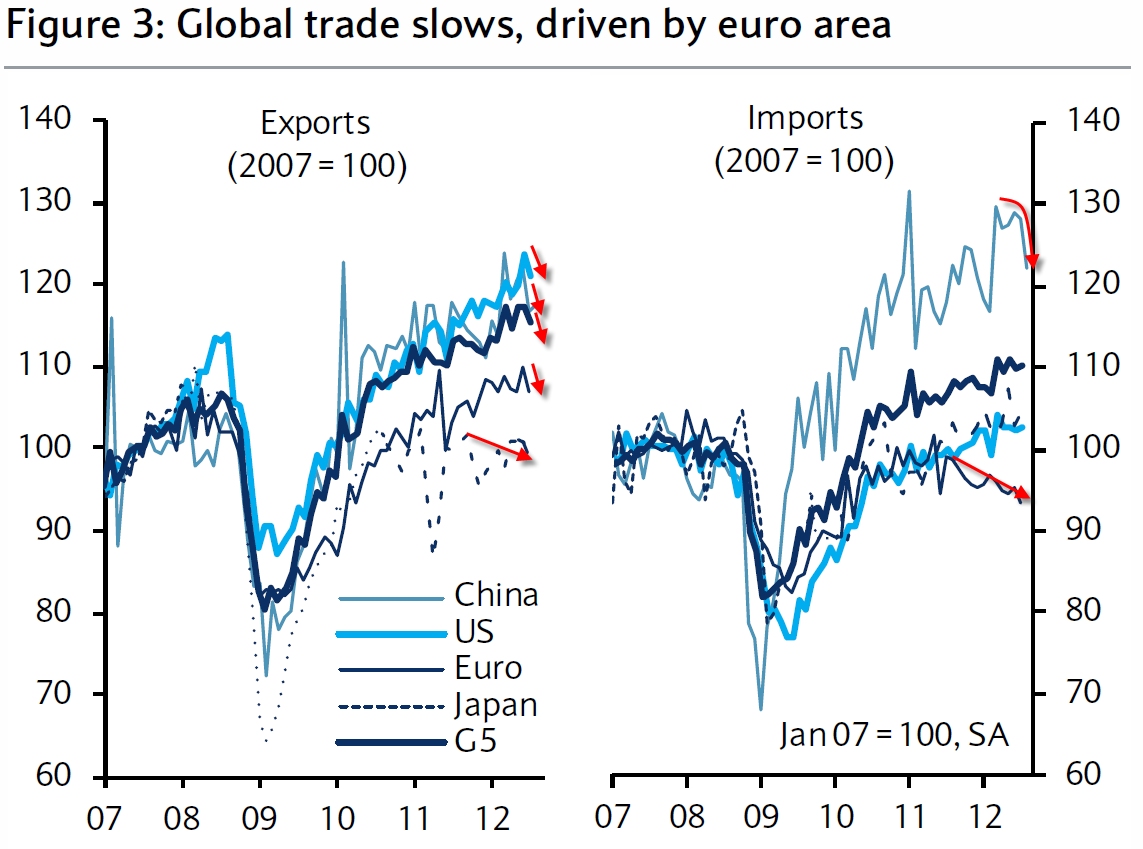
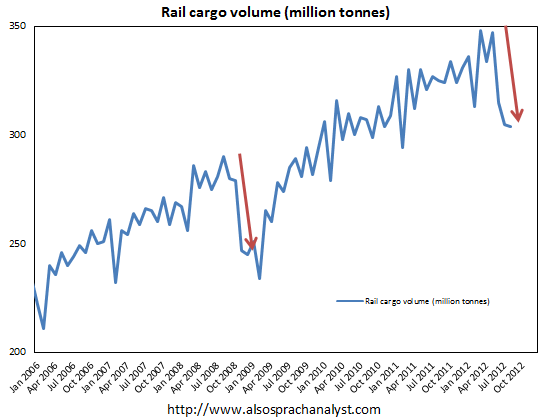
And with exports affecting the Japanese economy, I would like to turn to global trade, which Morgan Stanley recently pointed out was in contraction mode from a year before. Breaking down the data, we can see that global exports are falling in all major regions including US, Europe, China and Japan. At the same time, import demand coming out of Eurozone and China has been weakening significantly. Obviously, this goes hand in hand with global exports as the overall cycle becomes self-enforcing. Furthermore, trade volumes link closely to global industrial production and the current data continues to signal weak demand and rising inventories (a recessionary condition).

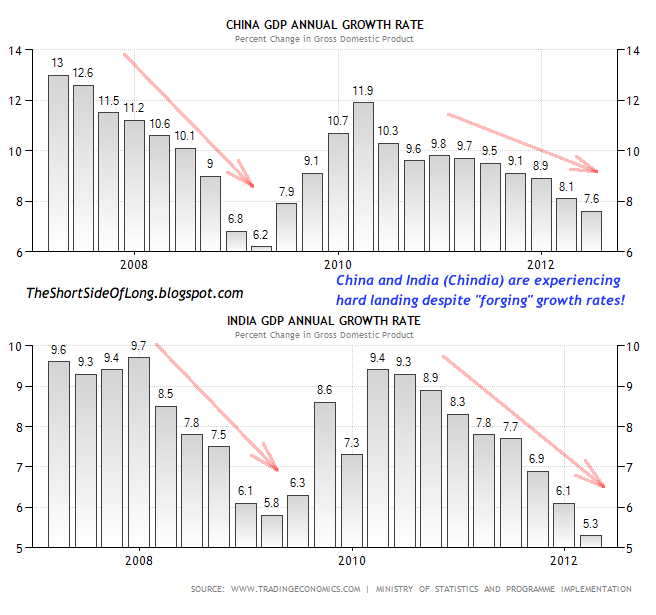
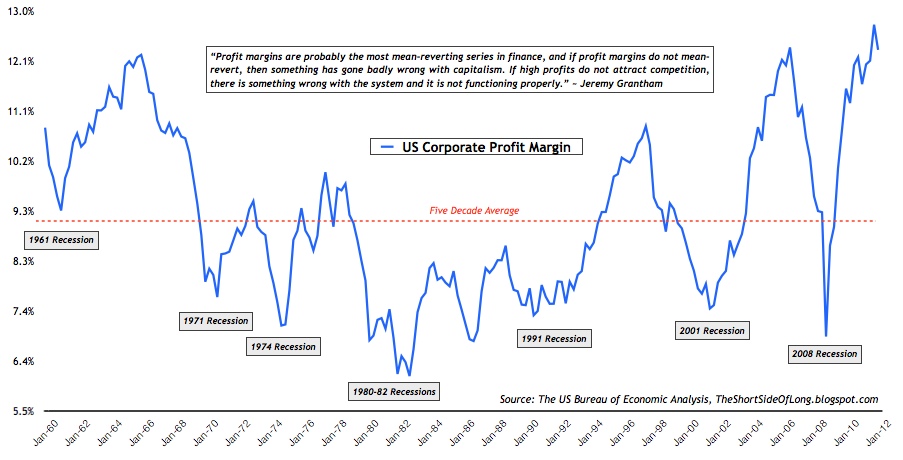
- Outlook: The Global economy continues to slow rapidly towards a recession. The United States GDP has grown below 2% for 5 out of the last 6 quarters. German GDP is also at stall speed, while China & India are slowing meaningfully with an increasing risk of a hard landing. US corporate earnings and gross profit margins are at record highs, so mean reversion is likely. Corporate revenue growth is already slowing.
- Important Indicators: Cash levels within mutual funds, retail investors and money market funds are at extreme lows, financial stress is starting to rise, volatility is at very complacent levels and credit spreads are very narrow relative to fundamentals.
- Long Positioning: Long focus is towards the secular commodity bull market, with positions in Precious Metals and Agriculture. The largest commodity position is held in Silver, due to central banks gearing to print money, as the global economic activity deteriorates. If a negative reversal occurs and global risk asset volatility rises, reducing positions will be appropriate. NAV long exposure is about 100%.
- Short Positioning: Short focus is towards the secular equity bear market due to deteriorating global economic activity. Exposure is held short in Junk Bonds, Technology, Discretionary and Dow Transportation. Tech stocks like the Apple parabolic and Amazon have been shorted with long dated OTM puts. Put options have also been purchased on the Pound and the Loonie (long USD). NAV short exposure is about 70%.
- Watch-list: A major short in due time will be US Treasury long bonds, as they are extremely overbought and in a midst of a huge bubble mania. While Grains have exploded up, Softs still present amazing value for long term investors, with Sugar being my second favourite commodity (after Silver). Japanese equities are down about 80% from their all time high over two decades ago and offer some great value.


