Profits and Commodities Part of Mixed Picture for Stocks
In a volatile environment, it is helpful to take a step back and look at the bigger picture. There are serious problems with debt in the United States and Europe, which are representative of the negative side of the bull-bear debate. On the positive side, companies are doing well and the technical picture of stocks remains firmly in bull market territory. According to Bloomberg:
Companies in the S&P 500 are poised to boost net income by 19 percent in 2011, including a 13 percent gain in the second quarter, according to analyst estimates compiled by Bloomberg. The gain will push profits back in line with their average increase of 6.9 percent over the last 51 years, data compiled by Brockhouse & Cooper Inc. and Bloomberg show. At the same time, the index is trading for 13.5 times projected 2011 earnings, 7.8 percent less than the average since the start of 2006.
Volatility can derail even competent investors. With big moves down, up, and down again in asset prices, it is helpful to ask this basic question:
Does the current environment look more similar to a bull market or a bear market?
From a technical perspective, the CCM Bull Market Sustainability Index (BMSI) tells us the current market looks nothing like a bear market, which means until conditions change, we should give the bull market the benefit of the doubt. The table below shows historical risk-reward profiles for various BMSI ranges.
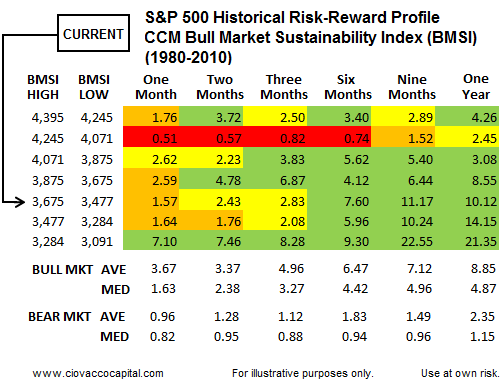
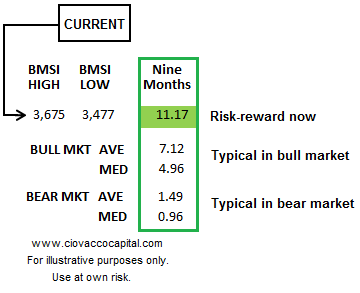
The current market falls into the BMSI range of 3,477 to 3,675 (see table above). Looking out nine months, historically similar markets have produced a very favorable risk-reward ratio for stocks coming in at 11.17. How does 11.17 compare to the average and median risk-reward ratios present during bull markets and bear markets? Not only does the current risk-reward ratio look nothing like what we find in bear markets, but the current profile is even more favorable than average and median conditions found in bull markets (see below)
The term risk-reward implies all markets have risk, including today’s market. However, market participants as a whole do not currently interpret the problems of the day as a threat to the bull market.
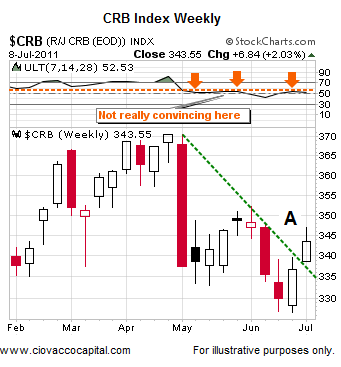
Looking from a bearish perspective, the market’s current sector leadership and asset class leadership is concerning. The weekly chart of a basket of commodities (CRB Index) shows a mixed picture (below). Commodities were able to break above the downward-sloping green trendline last week (point A), but the Ultimate Oscillator is stalling consistently near the orange arrows, which is indicative of a weak market.
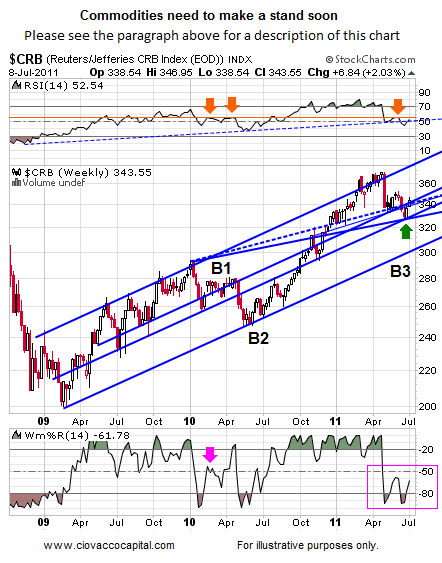
The chart below takes a longer-term perspective of commodities. It also shows a mixed picture. The Relative Strength Index (RSI) closed above 50 last week, which leans bullish. Two weeks ago, commodities held at a logical point (green arrow). Concerns include the inability of RSI to crack above the orange horizontal line (see orange arrows) and a weak move by Williams %R (pink box). If the CRB Index fails to hold above the green arrow, we may see a similar situation to what happened near B1 and B2. Commodities held for a time near B1, but eventually dropped to the lower blue trendline near B2. A similar break in the near future could see the CRB Index head toward the same lower blue trendline near B3. A move toward B3 would represent a decline in the neighborhood of 10% to 14% from the close on July 8, 2011.
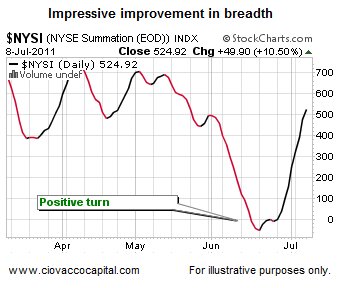
Shifting back to more bullish developments, stock market breadth has improved significantly in the last two weeks. The Summation Index, an intermediate-term measure of breadth, moved off the June low in a convincing manner. Healthy markets have broad participation in terms of the number of stocks advancing.
We have shown the chart below on numerous occasions. The thin lines are weekly moving averages for the S&P 500 Index ranging from the 20-week to 180-week.
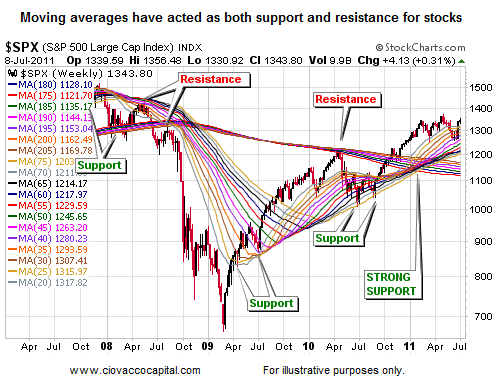
If we zoom into the chart above, we get the chart below. The picture below tends to lean bullish, especially from a longer-term perspective. Last week we closed above all the moving averages providing numerous forms of potential support for stocks (near point A). The green arrow shows a tight band of possible support near 1,220. Also notice the slopes of the moving averages above the green arrow tend to point up, which is what we want to see. The blue arrow highlights the flattening of the 175-week moving average (red line), which is also a positive for stocks.
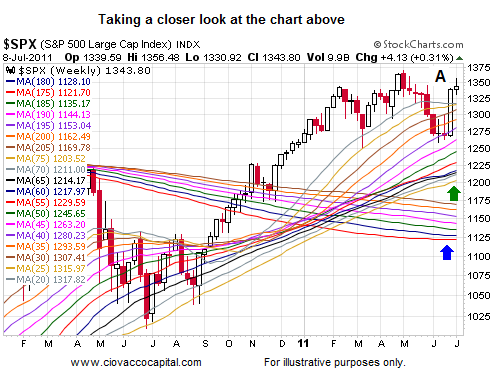
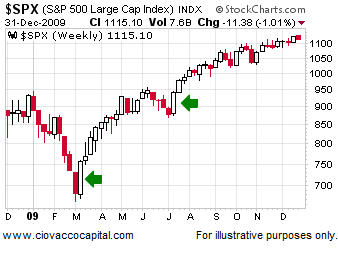
The other take away from the chart above is the impressive candlestick near point A. A long white candlestick shows significant buying interest in stocks. A candlestick of that nature is somewhat rare. A similar candlestick formed after downturns on two occasions in recent years (see green arrows in the chart below). Notice how stocks were able to post gains after the appearance of a similar candlestick.
This entry was posted on Monday, July 11th, 2011 at 10:09 am and is filed under Commodities. You can follow any responses to this entry through the RSS 2.0 feed. Both comments and pings are currently closed.


