So Much For Gold! Chinese Stock Market to Outperform!
By: Nu Yu, Ph.D. with Lorimer Wilson
There has been a great deal of excitement about the recent performances of gold and silver with most analysts extremely optimistic regarding their potential. That being said technical analysis shows that gold is in for some very choppy seas ahead compared to the surging seas of the Chinese stock market. Perhaps today the refrain “Got Gold?” should be replaced with the words, “Buy Chinese Stocks!”
Gold in a Bull Market With a Bearish Basis for the Intermediate-Term
At this point with the gold price sitting at an all-time high it has developed two major patterns that should draw our attention.

1. Ascending Broadening Wedge
The first pattern is a 7-year Ascending Broadening Wedge or megaphone formation confined by line A and line B. This pattern is similar to a rising wedge but with a broadening price pattern and it tends to appear in a bull market with a bearish bias. The most important feature of this pattern is that the swing amplitude between two boundaries becomes larger and larger, and price movement gets more and more volatile. This feature indicates that price sooner or later will have a downward swing to re-touch or re-test the lower boundary (line B), although the big upward swing generates a great attraction like fireworks.
Gold currently has a very broadening range between 900 and 1400. Once a downward swing happens, a drawdown could be very significant, with no mention of any potential downside breakout.
2. Rising Wedge
The second pattern is a 2-year Rising Wedge formation confined by line A and line C. This pattern also typically has a bearish bias but it can be realized only when a downside breakout happens at the lower boundary of the wedge. It looks like that two boundary lines of the current rising wedge on gold will merge at near the price of $1,500. It indicates there is a big potential for the price of gold to test the lower boundary line C of the rising wedge in the next three to six months before reaching $1,500.
A combination of an ascending broadening wedge and a rising wedge is a typical characteristic of a state of increased disequilibrium driven by overconfident market participants and is a sign of setting up a potential powerful volatility storm in the near future.
Shanghai Stock Exchange Composite Index Expected to Have a Fierce Advance Soon
Since the bearish Death Cross in the early part of this year (see chart below) the Shanghai Stock Exchange Composite Index (SSECI) has been depressed and has been in a downward channel for the last 14 months. However, a new uptrend should start after the bullish Golden Cross, which is defined by a successful breaking through both the 17-week moving average and the median line of the 14-month downtrend channel. Please note that my definition of the Golden Cross is different from the traditional Golden Cross of the 50-day and 200-day moving averages.
Indeed, with the Golden Cross being confirmed on October 8th, the SSECI has surged 10% and is fast approaching the target level of 3,000 at the upper boundary of the 14-month downtrend channel which probably will not be able to resist a fierce advance.

Three Peaks and the Domed House
A special chart pattern, “Three Peaks and the Domed House“, is emerging from China’s SSECI. With my modified version of George Lindsay’s basic model (see below), the “Three Peaks and the Domed House” pattern can be divided into five major phases:
1) Three Peaks phase,
2) Basement phase,
3) First Floor phase,
4) Roof phase, and
5) Plunge phase.
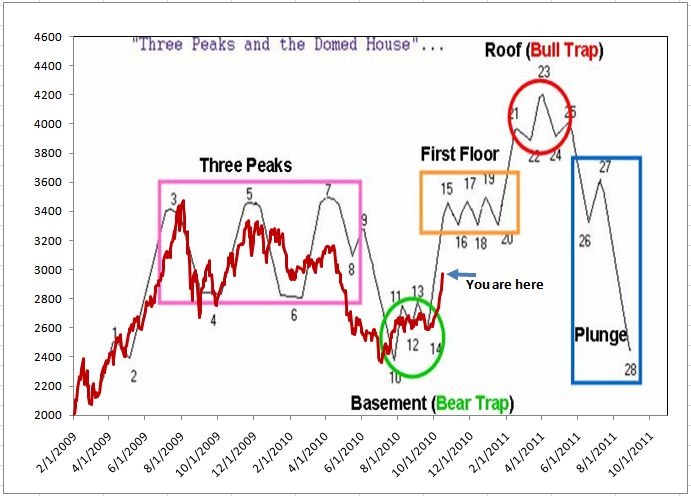
This modified version, using “phase-counting”, is a macro approach to Lindsay’s basic model, and it is different from the classical micro approach using “number-counting” from 1 to 28. In the chart the SSECI is plotted as a red line against Lindsay’s idealized model in a black line.
From June of 2009 to April of 2010, the Shanghai index developed the “Three Peaks” phase. Then it had a sharp separating decline to reach the July 2010 low at 2320 and formed the “Basement” phase during this summer. Now it just started a rapid advance in order to build the “First Floor” of the Domed House.
Calibrated against Lindsay’s model:
a) the SSECI should reach the “First Floor” phase near 3300 with a 10% upward move from the present price by the end of this year
b) the target “Roof” phase of the Domed House is projected at 4200 for the SSECI by the middle of next year which represents an 81% upward measured move from the low of the “Basement” to the high of the “Roof”.
(Last week Market Vectors China ETF (PEK) was launched by Van Eck Global with the claim that it is the first and only U.S. listed ETF designed to give investors exposure to China’s A-Shares market. It would appear to be a very timely introduction!)
Conclusion
There you have it! The ascent of the price of gold to $1,500 is going to be VERY volatile over the next few months while the Chinese stock market is about to take off in a major way. The choice is yours.
Please Note: Don’t forget to sign up for munKNEE’s FREE weekly “Top 100 Stock Market, Asset Ratio & Economic Indicators in Review”
Dr. Nu Yu (fx5186.wordpress.com/), co-founder and president of Numarkan Investments and an affiliate of the Market Technician Association, is a frequent contributor to www.munKNEE.com “It’s all about MONEY” and www.FinancialArticleSummariesToday.com “A site/sight for sore eyes and inquisitive minds”. He can be contacted at editor@munknee.com


