Stock & Gold Markets Technical Update
I’ve consulted with the best in the business, and spent the past week tightening up my template, so 100% of the focus in my newsletter is on trading markets. I want to give you maximum coverage of all the major markets in play, as I trade them myself. To do that, at the level of professionalism I demand from myself, I have to leave economic and political commentary to others in the gold community who are much better at it that I am. To make you the most money, I need to focus 100% of my time and effort on what I do best, which is technical analysis of price and volume.
The stock market is now front and center on my radar screen, and my technical work is flashing substantial signals of danger. I believe the talking heads on financial TV are drastically underestimating how fast and hard the stock market could sell-off. Look carefully at my SPY chart below. This situation could get very, very ugly.
SPY (S&P500 Proxy) Chart
SPY (S&P 500 Proxy) Chart Analysis:

- On Feb 16th, I issued a Super Force sell signal for SPY at $133.85. Since the November 2010 lows, the stock market rally has been strong, and the perma-bulls now think nothing can go wrong. All things, even the strongest things, must pass. My indicators on the S&P500 are flashing strong warnings for the stock market, both in the near & intermediate term. Two of these financial foghorns blaring loudly right now are:
- The Super Force sentiment Greed Index is in danger mode. The indicator is now in the area where serious corrections have come in the past. The popularity of domestic equities may not pay off anytime soon, if at all, for investors who have the poorest track record, and are now climbing on board; their buying is helping put the market into the danger zone.
- Second, the S&P 500 has reached an incredible height of 16% above its 200 day moving average; a higher spread than any time in the last ten years! My indicators are projecting the S&P 500 could easily lose as much as 20%, just over the next few months!
- On Feb 15th I issued a powerful Super Force short sale signal for SPY in addition to the sell signal. There is a big stock market correction coming, and when it does arrive, it might bring down gold stocks too, although events in the Mid East are now in play that can change charts quickly. Gold stocks could actually rise if oil goes parabolic, as the stock market tumbles, but even if oil falls and gold stocks are dragged down with the general stk mkt, an SP500 short position protects your gold stocks portfolio!
- In addition to my technical analysis work, you need confidence to make your move, when shorting the general stock market. You want to be in the company of market winners. Well, right now you have Jim Rogers, one of the greatest investors of all time, going short the Nasdaq and Emerging Markets. Stewart Thomson bought the Dow right into the low of 6500, and now he’s going short. The published unemployment numbers are getting rosy, and the weakest investor hands are buying the good news after the S&P500 shoots up 100%, while the market sharks aren’t having any of this malarkey. The sharks are circling, ready for a feeding frenzy!
- As Gold was making its lows in January at around $1308, one of the recommendations I made to you in January was to switch domestic stocks positions into Gold stock positions. I am absolutely comfortable with that call!
Gold and Precious Metals
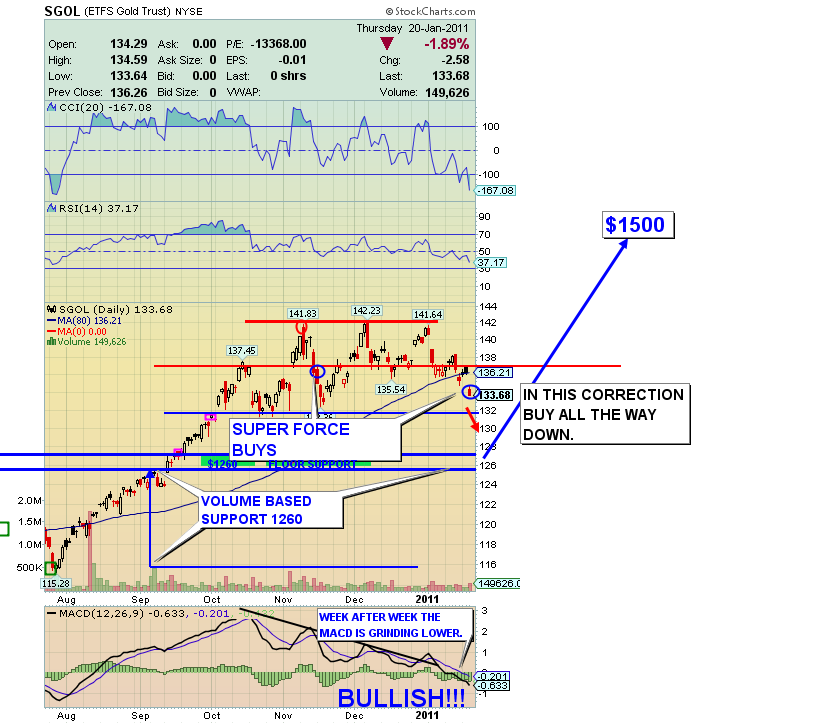
- On March 1, I issued a Super Force Profit Taking Signal for SGOL traders, as escalating unrest in the Middle East helped drive Gold to an all-time high. When the stock market was headed straight up, Gold was in a correction. Now, stocks are stalling out, and Gold is hitting new highs! Events like you are witnessing in the Middle East are a key reason to buy and hold Physical Gold Bullion.
- After calling the December top in Gold almost to the dollar, my charts suggested the next low could come in around $1260. It now appears that $1308 was the bottom. I blew the bottom call for bullion by $60, but I still issued several buy signals on SGOL as price fell over $100, and those positions were sold at excellent profits as we rallied back to new highs. I said to you on Feb 4:
“Don’t just buy my target, but instead buy all the way to my target, because sentiment figures are continuing to improve in this severely oversold market. The bottom could be put in at any time.”
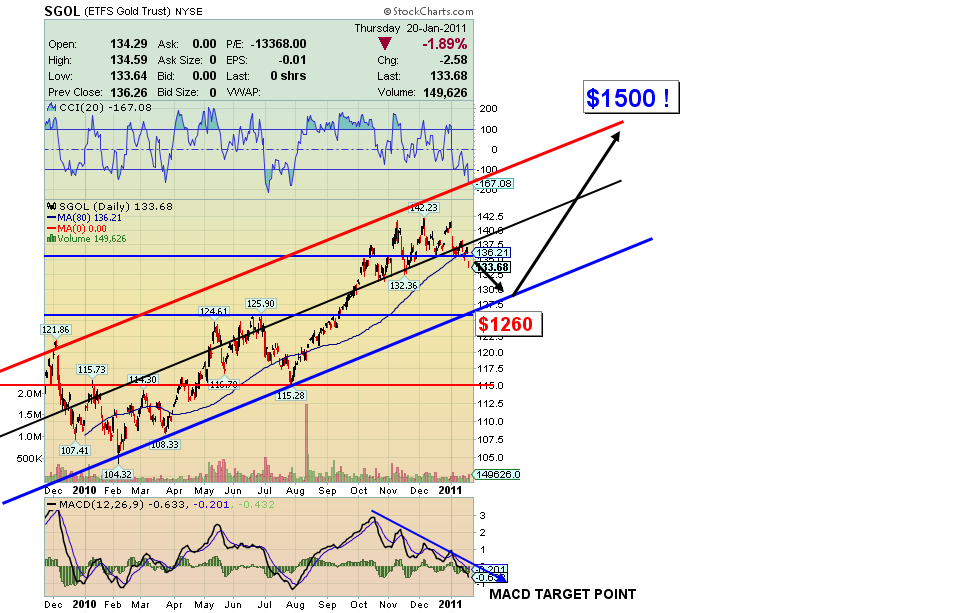
- With the one exception of SGOL, my correction targets for the metals group (GDX, GDXJ, SIVR) were hit. The new lower band target for Gold is now the $1300 level. We’re in an uptrend, and time has passed, so the worst case low point targets are rising with the uptrend.
- If we push much higher in Gold from here, the momentum crowd could join the party. When that happens, price can zoom higher for a while, but such rise is followed by violent corrections, which are going to be your buying opportunities.
Gold Juniors GDXJ Chart
Gold Juniors Analysis:
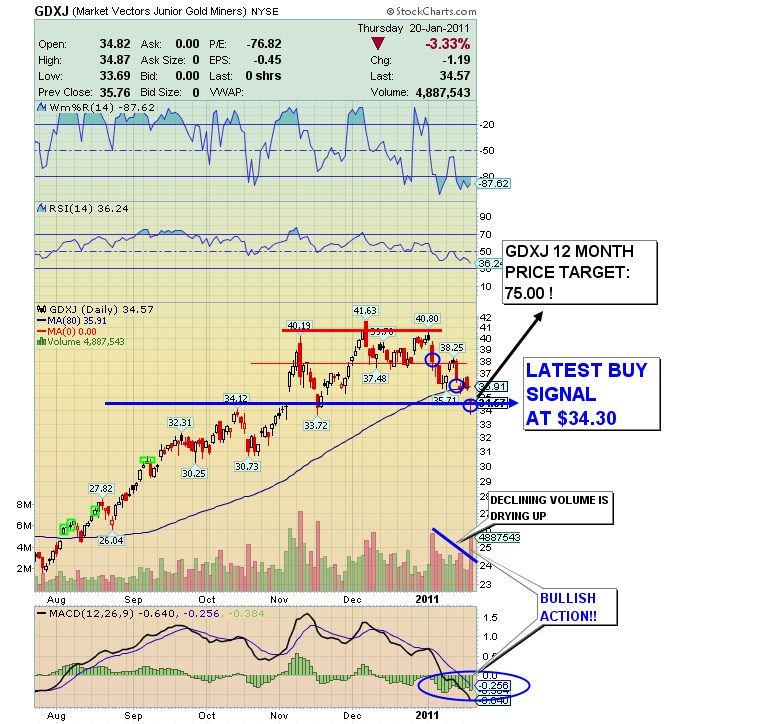
- On Feb 8 2011, I issued a Super Force profit taking alert for GDXJ, at $38.27. I was a heavy buyer into the January lows on GDXJ, which is absolutely one of my favorite long term plays! If you bought January’s decline, you should be shaving some profits off, on this powerful rally.
- Strong volume support sits in the $34 area. Price could easily retrace back there. Such a retreat is even more likely if my scenario of a larger general stock market correction plays out against the backdrop of a quiet Mid East and softer oil prices.
- The higher prices of the last few weeks in Gold have been partially a result of geo-political events. These types of gains can quickly disappear if things appear to calm down, so let me repeat: you need to at least shave off some profits, into this rally.
- For GDXJ, my momentum stock ratio projects $75.00 per share within 12 months. Imagine where GDXJ (and your individual juniors) could be, if Gold hits $1500, 1600 or even higher, which is likely this year. I continue to believe that when the GDXJ price breaks up and out of this area, there will be no looking back.
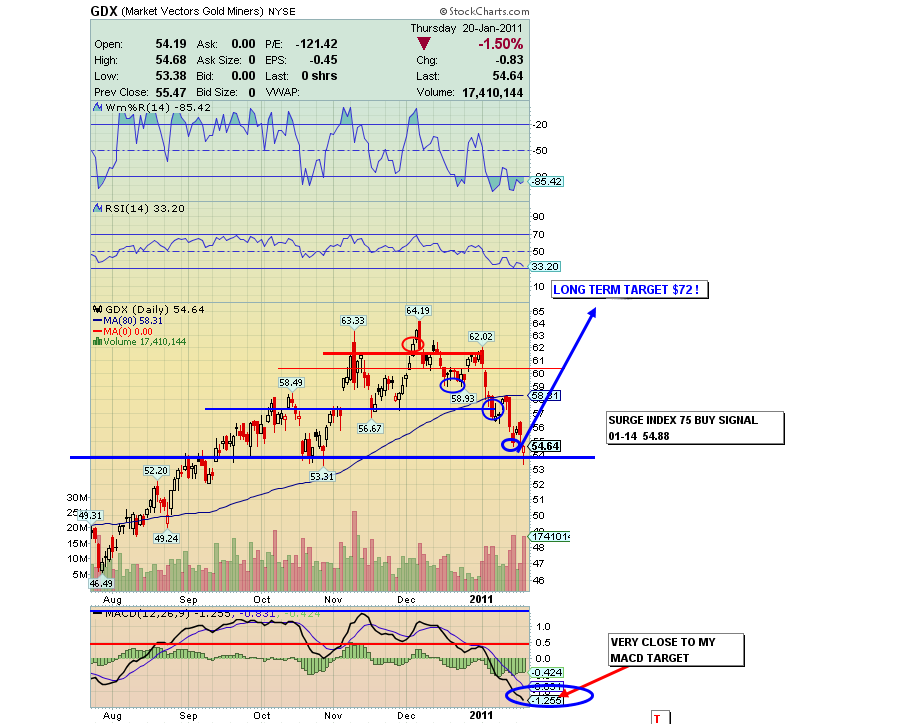
- On Feb 18th at $59.50 I issued a profit taking signal for GDX. Fundamentally, Gold Seniors stocks are one the best values on Wall Street. These stocks are absolutely going to catch on fire as the price of Gold continues higher. In December 2010, my Super Force Momentum Stock Ratio produced a GDX target of $72. We are already within 15% of the target. Price could easily exceed $72 by Dec 2011.
- For GDX, strong volume support sits in the $55.00 area. Price could easily go back to that point in the coming stock market correction. When looking beyond the next 12 months, it’s safe to say prices should be dramatically higher, and quite possibly multiple times higher.
SIVR (Silver Proxy) 6 Mth Chart
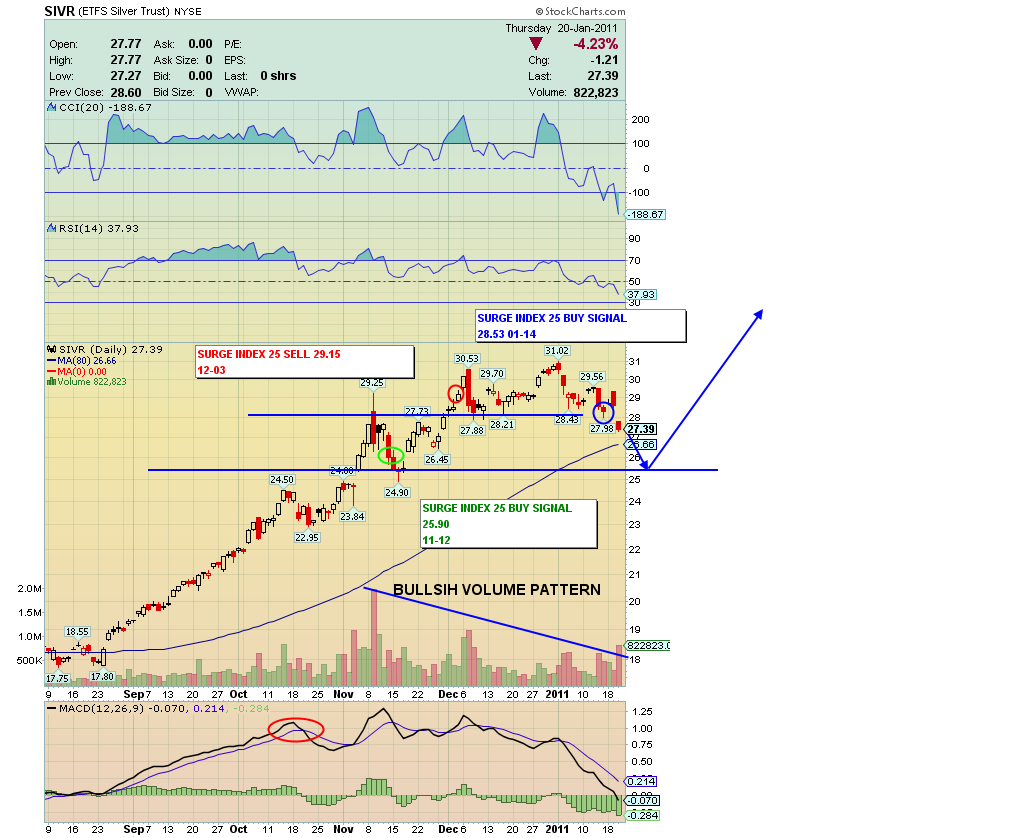
- On Feb 23rd, at $33.26, I issued a profit taking signal for SIVR. Silver broke out to multi-decade highs, exceeding my short term target. That price overshoot has produced a bigger SFS $50 target on my longer term charts, projected within 12 months.
- I have noted for many weeks that the physical market seems to be outrunning the paper market. My Silver dealer contacts report this week that Silver continues in a tight physical market, tighter than Gold!
- Owning the physical product is an absolute necessity in my opinion. As I got fresh buy signals in silver, I put more money in physical silver in the $28.00 area. Use my buy signals to buy SIVR, and add to your physical inventory!
Unique Introduction For Web Readers: Send me an email to alerts@superforcesignals.com and I’ll send you 3 of my next Super Force Surge Signals, as I send them to paid subscribers, to you for free! If you want more details on the system itself, send me an email to clarity@superforcesignals.com and I’ll send you the 3 set video series I’m putting together! Thank-you!
The SuperForce Proprietary SURGE index SIGNALS:
25 SuperForce Buy or 25 SuperForce Sell: Solid Power.
50 SuperForce Buy or 50 SuperForce Sell: Stronger Power.
75 SuperForce Buy or 75 SuperForce Sell: Maximum Power.
100 SuperForce Buy or 100 SuperForce Sell: “Over The Top” Power.
Stay alert for our SuperForce, sent by email to subscribers, for both the daily charts on Super Force Signals at www.superforcesignals.com and for the 60 minute charts at www.superforce60.com
About Super Force Signals:
Our SuperForce Signals are created thru our proprietary blend of the highest quality technical analysis and many years of successful business building. We are two business owners with excellent synergy. We understand risk and reward. Our subscribers are generally successful business owners, people like yourself with speculative funds, looking for serious management of your risk and reward in the market.
Frank Johnson: Executive Editor, Macro Risk Manager.
Morris Hubbartt: Chief Market Analyst, Trading Risk Specialist.
Email:
trading@superforcesignals.com
trading@superforce60.com


