The Best Historical Comparison for Gold & Silver
One reason the history of markets is fascinating is that we can glean clues about the future. History does not always repeat itself, but it often rhymes.
For precious metals, the last six years lack a strong comparison.
There has not been a similar period in which the Gold price rallied back to its all-time high, while the dollar was buoyant and the stock market remained in a secular bull market.
One must use Intermarket Analysis and look beyond nominal terms to find a comparison.
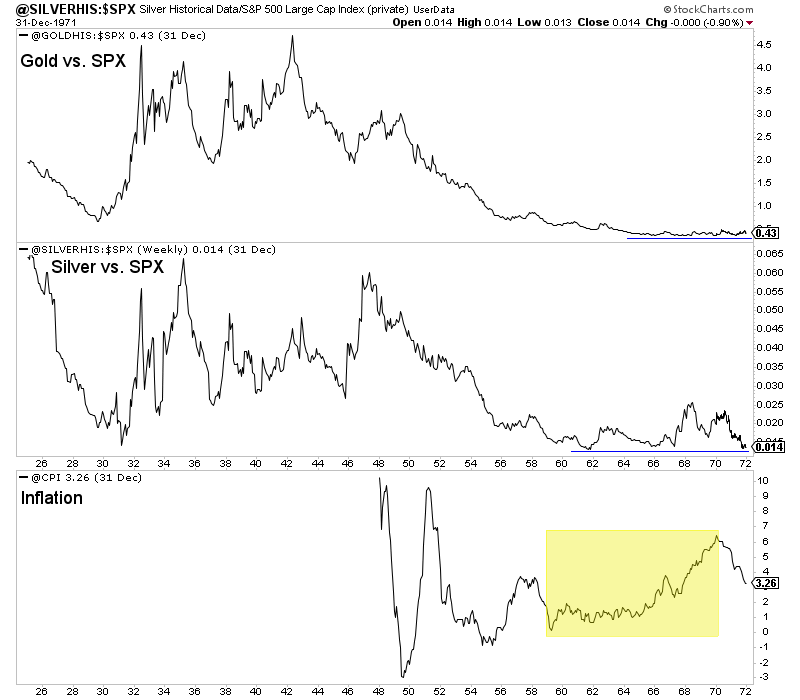
For example, the Gold to S&P 500 ratio is lower than six years ago, but Gold is much higher.
I have mentioned it occasionally, but in terms of the Gold to S&P 500 ratio and Expected Returns, the current period resembles the mid to late 1960s. (Expected Returns from a 60-40 portfolio are calculated from Schiller’s Excess Cape Yield and the 10-Year Treasury Yield.
In the chart below, the vertical black lines show the start of the three secular bears, triggered when Expected Returns were historically low, and the S&P 500 lost its 40-month moving average.
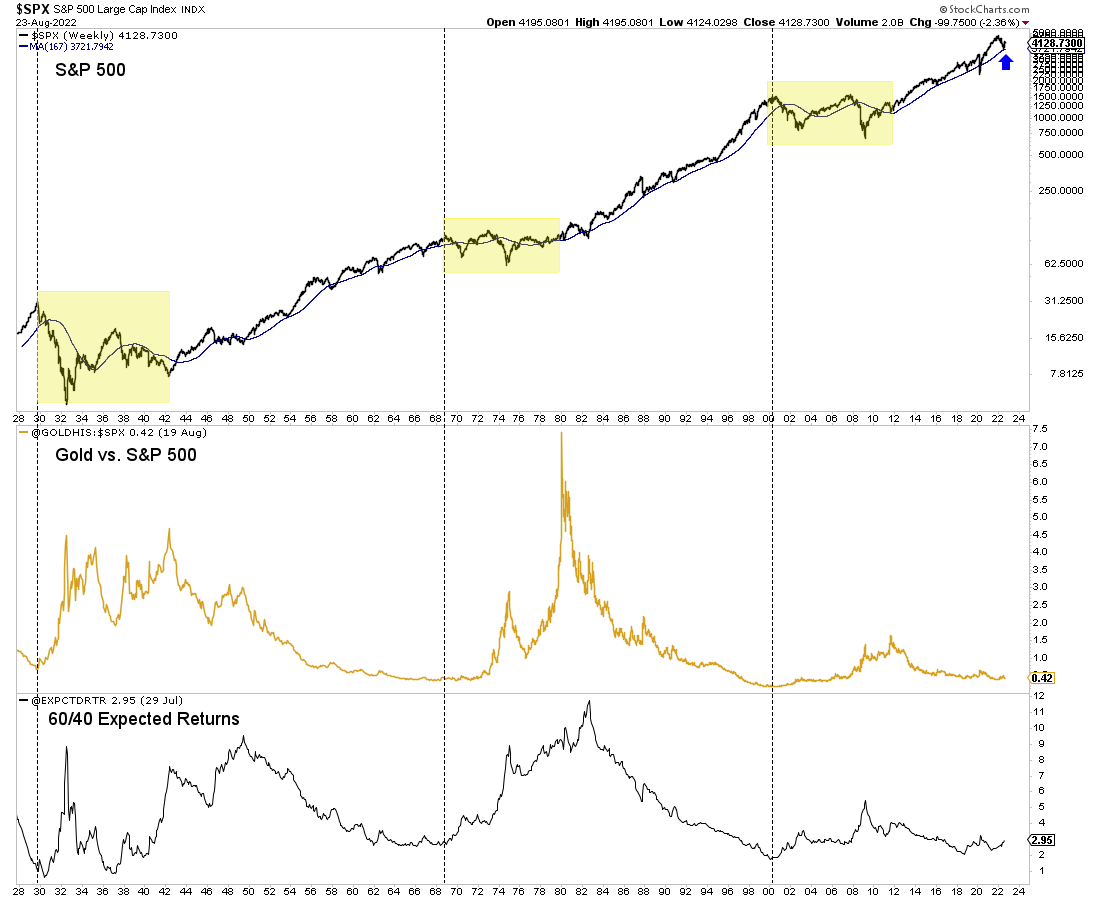
The present macro-market construct shares similarities to the very end of the 1960s.
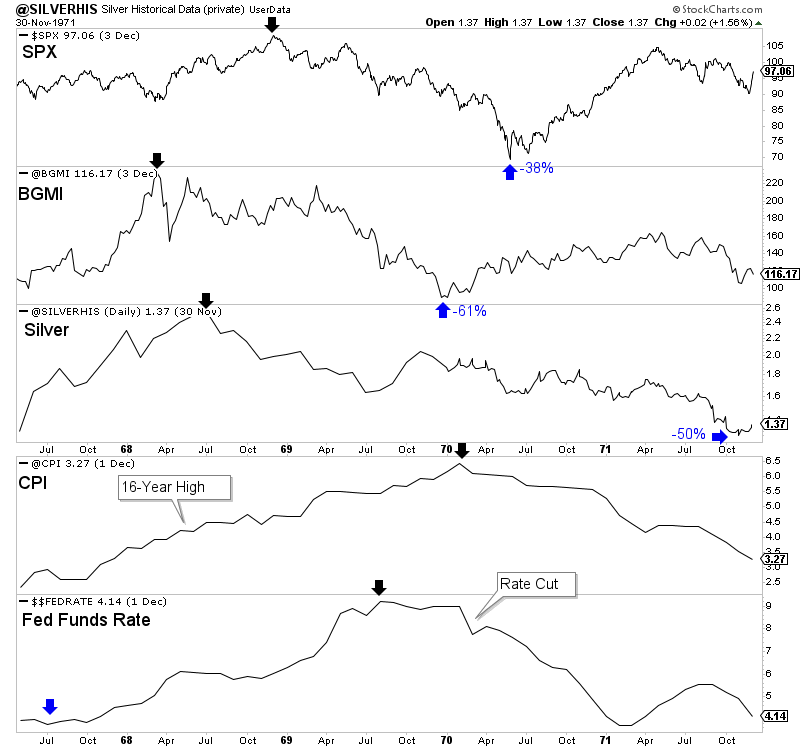
The inflation rate made a major breakout in the first half of 1968. This was the first point in modern times during which inflation became a major issue, like in the present.
The Fed hiked rates from roughly 4% in mid-1967 to approximately 9% in mid-1969, while the S&P 500 began a 16-month long and 38% decline in December 1968.
The gold stocks (BGMI) and Silver peaked in the first half of 1968 when inflation (CPI) broke out to a 16-year high. Nearly two years later, inflation peaked in January 1970. Precious Metals peaked two years ago (August 2020), and inflation likely peaked in June 2022.
Gold stocks, which declined 61%, bottomed a year after the S&P 500 peaked and one month before the Fed cut rates. Silver required more time to bottom and was cut in half.
In real terms, precious metals today look much like they did roughly 50 years ago.
They were trading at the lowest levels in decades. And that was only a year or two after inflation had steadily risen for five years from 1% to over 6%.
The Gold price was fixed, and gold stocks performed well in the 1960s, but that was because then, gold stocks did not compete for capital with TIPS, emerging markets, and even Gold.
Nevertheless, the comparison to today remains on point. The Fed then was fighting the first major bout of inflation in decades, and amid their fight, precious metals corrected to historically low levels in real terms.
The initial turning point was the S&P breaking its 40-month moving average, roughly 12 months into the bear, gold stocks bottoming a month later, and the Fed cutting rates the following month.
That, among other things, led to explosive gains over not just the following two to three years but the entire decade.
I continue to focus on finding high-quality juniors with at least 5 to 7 bagger potential over the next few years. To learn the stocks we own and intend to buy, with at least 5x upside potential after this correction, consider learning more about our premium service.