The Fed, the Fear Index, and the Dollar
Bloomberg provides some insight into the current two-day Fed meeting:
“The Fed is not ready to let up on its accelerator,” said Gramley, senior economic adviser for Potomac Research Group in Washington. “They are going to be impressed with the fact the economy has gained some momentum, but there are still strong headwinds to growth, and bank lending is quite modest.”
Policy makers will probably affirm their plan to buy Treasury securities through June to reduce long-term yields and spur lending, said Mark Gertler, a New York University professor and research co-author with Bernanke.
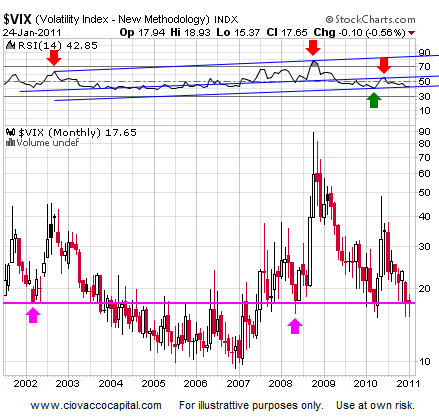
With the markets not having experienced a correction for some time and the Fed due to release a statement tomorrow, it is prudent to review some big picture issues. The VIX, or the “Fear Index”, falls when investors are less concerned about volatility or pullbacks. Conversely, the VIX rises when concerns about volatility and possible corrective activity begin to mount.
The chart below is a monthly chart of the VIX going back to 2002. The VIX is at a level where it could logically reverse and begin to move higher, which would most likely coincide with a pullback of some kind in risk assets. Two things we are monitoring relative to the VIX are highlighted in the chart. The parallel blue trendlines in the Relative Strength Index (RSI) have acted as both resistance (red arrows) and support (green arrows) – notice the blue line is at a point where it could provide support for the VIX. A break below the lower blue RSI trendline would open the door for another push higher in risk assets.

The pink line (above) and arrows show areas where interest in the VIX picked up in 2002, 2008, and in 2010. The VIX is currently holding near the pink support line.
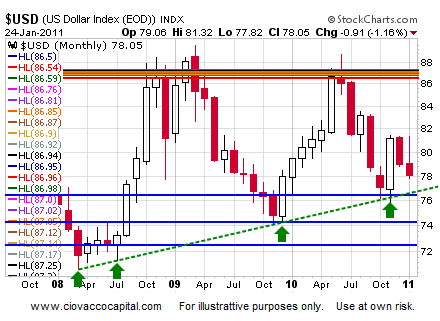
Tomorrow’s Fed statement will be analyzed closely by the currency markets. The monthly chart of the U.S. Dollar below leans toward the greenback making a move toward 76, although it may not occur until after a move higher.

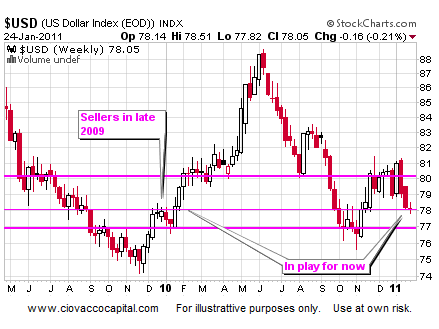
Like the VIX, the weekly chart of the U.S. Dollar sits at a point where a short-term reversal would be logical. Notice how the candlestick is hanging on the thin pink line.

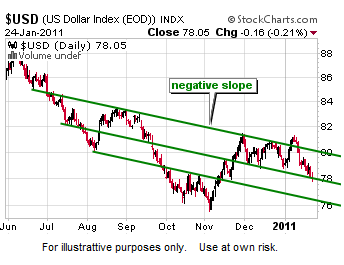
The daily chart of the U.S. Dollar Index, shown below, also indicates a move higher bouncing off the green support line is one logical outcome over the short-term. Even if the buck moves higher in the short-to-intermediate-term, the negative slope of the green parallel trendlines remains an ally of the bears.

As outlined in late October 2010, the Fed’s quantitative easing program (QE2) is more about asset prices and balance sheets than interest rates and the economy. In this context, it appears unlikely the Fed will scale back QE2.
CCM Clients: I have been in Tampa since Sunday – I return to Atlanta today. It may take me a day or so to catch up on emails.
This entry was posted on Tuesday, January 25th, 2011 at 10:01 am and is filed under Fed Policy. You can follow any responses to this entry through the RSS 2.0 feed. Responses are currently closed, but you can trackback from your own site.


