This is When Gold Will Soar…

Despite the insistence of some, precious metals have not been in a bull market. After a big pop at the start of 2016, the sector has trended lower. Sure, Gold has traded up towards a major breakout but Silver and the gold stocks have trended lower. When the US Dollar corrected significantly, the stock market outperformed precious metals. Does that sound like a Gold bull market to you? The moribund performance has left us wondering what could turn the tide. A quick study of Fed history with the context of current conditions is very instructive as to when Gold could begin a true bull market.
Fundamentally speaking, we know that Gold performs best when real rates are declining or will soon begin declining. That usually entails either accelerating inflation (surpassing the increase in nominal rates) or falling rates amid stable inflation. At this juncture we are leaning towards the latter as the eventual catalyst for Gold.
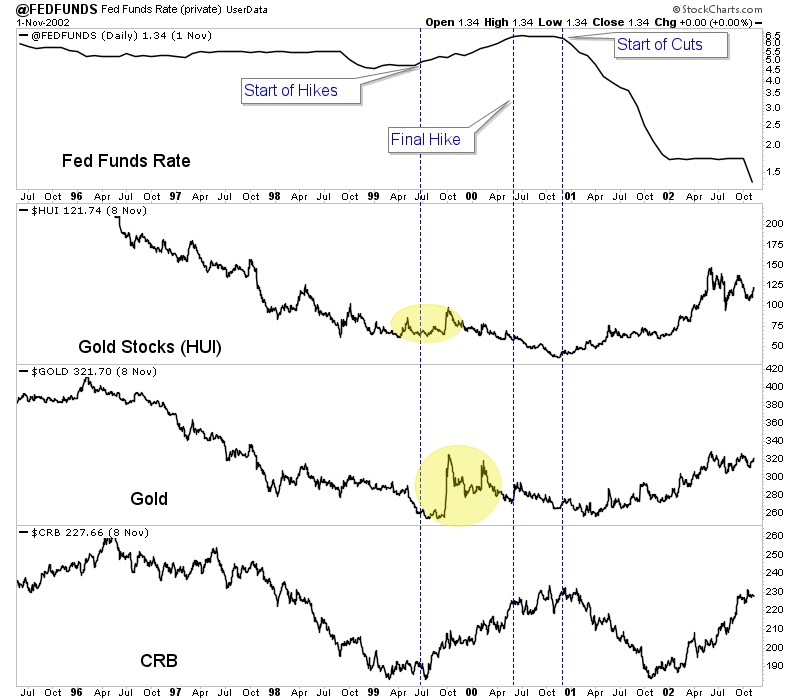
We were curious how Fed policy and policy changes impacted precious metals so we decided to plot the Fed Funds rate (above) along with gold stocks (middle) and Gold (bottom). We used the gold stocks (Barron’s Gold Mining Index) because they have a longer history than Gold. The vertical lines in blue mark lows in the BGMI that coincided with peaks in the Fed Funds rate (FFR) while the vertical lines in red mark lows in the BGMI that coincided with a bottom in the FFR.

Outside of the highly inflationary 1970s, the best bull markets in gold stocks began around the time the Fed Funds rate peaked (or in other words when the Fed ended its rate hikes). Lows in 1993, 1999 and 2016 coincided with the start of a new hiking cycle. However, unlike the lows in 1972 and 1976, inflation did not accelerate enough to drive more than a rebound.
Does that signal that gold stocks (and precious metals at large) need an end to the rate hikes?
The period from 1999 to 2001 is very instructive as there are several similarities between 1999-2000 and 2016-2017.
Like 1999, 2016 followed a nasty bear market in Gold and hard assets.
Also, the 1999 bottom in precious metals and commodities occurred around the time the Fed began a new cycle of rate hikes. Sound familiar to 2016?
As the Fed continued to hike into 2000, Gold and gold stocks trailed off but commodities were able to make higher highs until the very end of 2000. Commodities have not been quite as strong this time but they have outperformed precious metals which have trailed off since the initial rebound.
Gold and gold stocks ultimately bottomed and began spectacular rebounds around the time the Fed moved from a pause in rate hikes to rate cuts at the very start of 2001.
Unless there is an acceleration in inflation, the turning point for precious metals figures to be around the time the Fed ends its rate hikes. That would likely coincide with Gold regaining outperformance against the stock market, which we have noted as Gold’s missing link (from an intermarket perspective). Weakness in the economy and stock market would lead to an end to the rate hikes and then rate cuts. That would be the time Gold and gold stocks begin a major move higher. In the meantime we continue to focus on and accumulate the juniors that have 300% to 500% return potential. To follow our guidance and learn our favorite juniors for the balance of 2018, consider learning more about our service.