I’ve been discussing the equity markets quite a lot in the last several weeks, but in my opinion the real action is eventually going to occur in the commodity markets, especially in the Precious Metals sector. Over the last several quarters, this sector in particular has under-performed against equities as well as bonds. But that might change very soon.
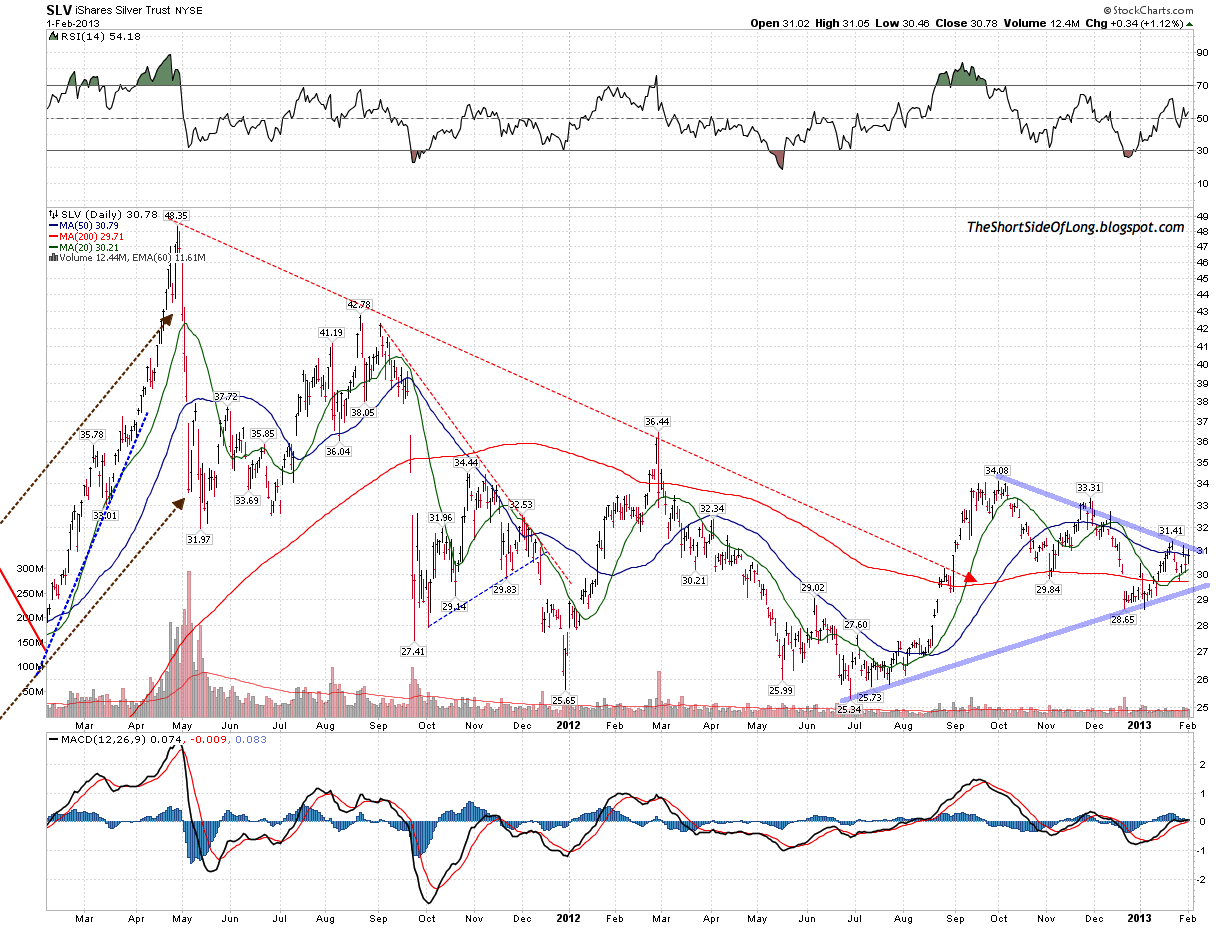
Chart 1: Precious Metals at technical decision points
Source: Short Side of Long
It has come to my attention, from a technical price action perspective, that Precious Metals are now at some type of an important crossroad. Consider the chart above, which shows Gold and Silver technical triangles, as well as major support and resistance lines. The major support levels for the metals are $1,550 and $27, while major resistance levels are $1,800 and $35 respectively. Interestingly, the triangle battle between bulls and bears is currently right in the middle of those trading ranges and an eventual decision point is coming very shortly. Furthermore, the current price action for both metals is coiled between the 50 day MA on the upside and the 200 day MA on the downside. A breakout or a breakdown will most likely set a trend for the next few months.
Chart 2: Post election seasonality supports a bullish breakout
We have just went through an interesting seasonal period for financial markets – the US election. While the US stock markets almost always tends to rally into an election period, Precious Metals tend to decline. More importantly, the post election period tends to be one of seasonal strength for the Precious Metals sector, as seen in the chart above. Usually, some type of an intermediate low occurs at the beginning of February and the current technical triangle could be a perfect catalyst for a price rally.
Chart 3: Unlike equities, sentiment in Gold is one of disinterest

Source: Short Side of Long
Sentiment also supports a possibility of an upside breakout too. In the previous PMs update written on the 11th of January 2013 (link:
Entering Into 2013 – Part 3) while discussing the sentiment picture, I wrote:
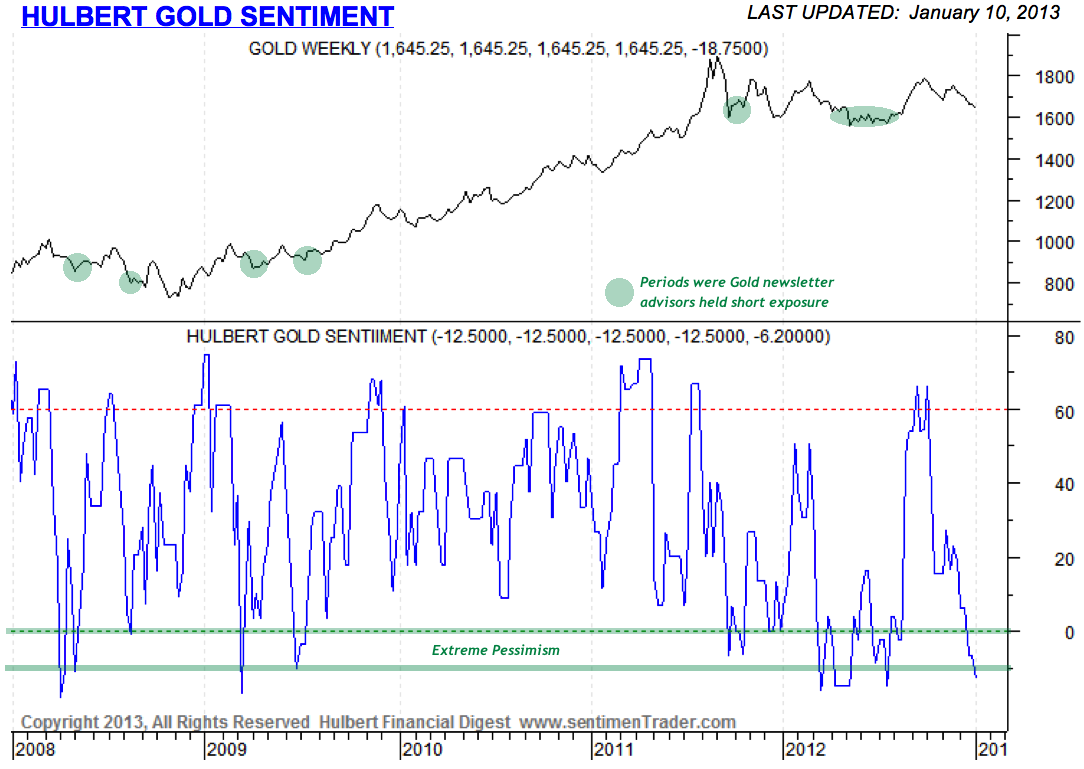
“…sentiment itself is once again starting to turn pessimistic. The recent Daily Sentiment Index readings on Gold and Silver reached single digits. Last Friday, we witnessed only 6% bulls, which is one of the lowest readings since May 2012, when Gold bottomed at $1530. Furthermore, as we can see in the charts above, Silver’s public opinion is entering levels usually associated with extreme pessimism while the Hulbert newsletter advisors are recommending one of the highest short exposures to Gold in years. While all of this does not have to indicate higher prices automatically, it tells us that we are much closer to the intermediate bottom.”
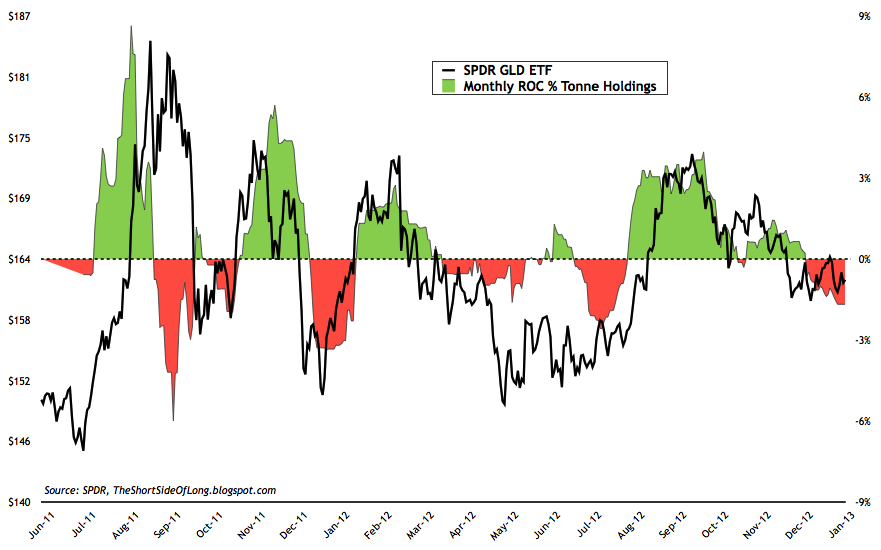
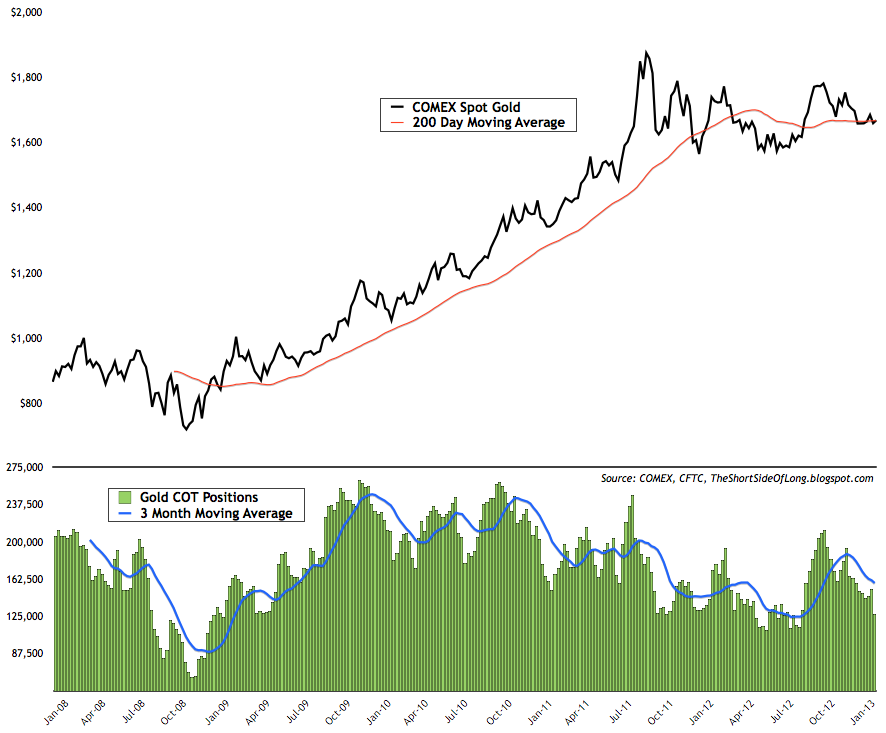
Since then, we’ve seen sentiment in other indicators also deteriorate further. Consider the charts above, which show that physical Gold holdings within the GLD ETF continue to bleed out, while hedge funds have reduced net long positions to the lowest level since August 2012, when Gold bottomed at $1,530. While neither of these indicators signal that we will definitely rally, the probability of a bullish case scenario continues to increase. One thing is for sure, bullish expectations seen in October 2012, when the majority of strategists, analysts and newsletter writers expected Gold at $1,900 has subsided.
Gold Miners also remain oversold and out of favour for weeks now. Traders and investors everywhere have been throwing in the towel, which usually indicates that a bottom is near. Furthermore, Rydex PMs Fund Flows indicate extreme pessimism only witnessed during the panic of 2008 as well as a major sell off into May of 2012.
Chart 4: Gold Miners are oversold on relative basis
Source: SentimenTrader
Furthermore, looking at the recent breadth numbers within the whole sector, we note that only 15% of all miners are trading above the 50 MA and 23% above the 200 MA. Also, breadth indicators like McClellan’s Oscillator and Summation Index both signal an intermediate bottom is at hand. Comparing these oversold readings against the general stock market, which is currently in euphoria, shows a large contrast. Financial stocks have more than 90% of components above both the 50 MA and 200 MA. Just about every other major equity sector is also overbought. Therefore, a correction in equities could send some money back into Gold Miners, as we experience somewhat of a mean reversion.
Chart 5: Long term demand will remain robust as global currencies are devalued
Observing the recent financial reports in my mailbox throughout January, has me convinced that the majority of investment banks have now given up on the Gold bull market. Bloomberg analyst expectations show prices of Gold to be below $1,600 over the next few years. While the correction could go on for awhile longer, I obviously disagree strongly with Wall Street on this one. In his recent newsletter, Frank Holmes showed that just about every major central bank has plans to increase their balance sheets well beyond 2013. In other words, important currencies around the world are being devalued and the only way one can protect themselves in the long run is to own assets which will adjust to this currency devaluation. While some prefer equities and others prefer real estate, history shows that the best way to protect yourself during times like these is to own very rare and mostly precious assets.
Chart 6: Gold is not in a bubble…
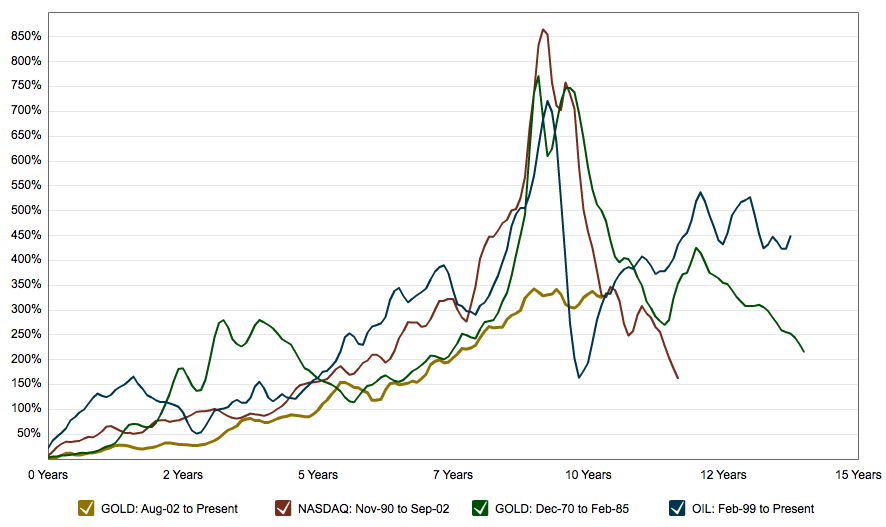
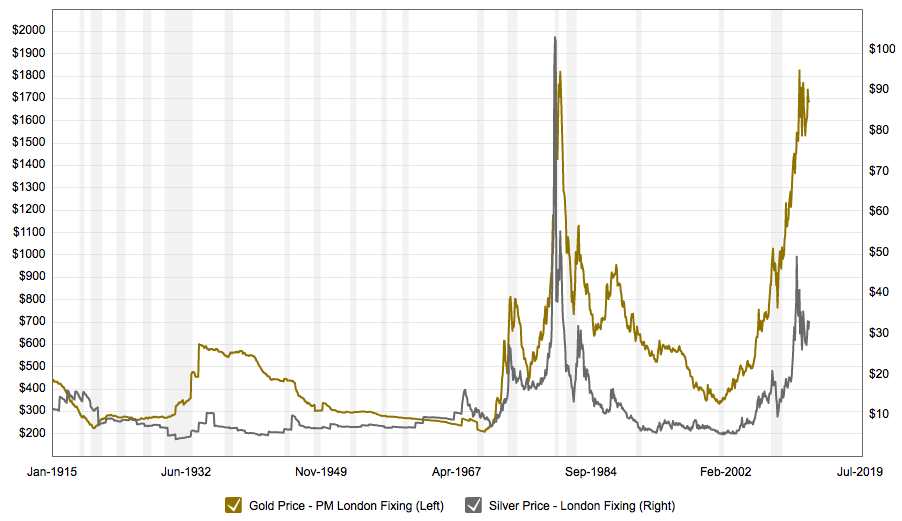
I do admit that Gold has risen very sharply over the last 12 annual years and since middle of 2011, I have been calling for a prolonged consolation period and even a major cyclical bear market. It is only normal for assets to correct 30% to 40% every few years, especially great performers such as Gold over the last decade.
However, the talk of a Gold bull market end is very premature and the talk of Gold being in a bubble is ludicrous. The Macro Trends chart above shows that overlapping Gold with previous major bubbles in the Nasdaq, Crude Oil and even Gold throughout the 1970s, shows the current price at very un-elevated and inexpensive levels.
Chart 7: … and could surprise on the upside!
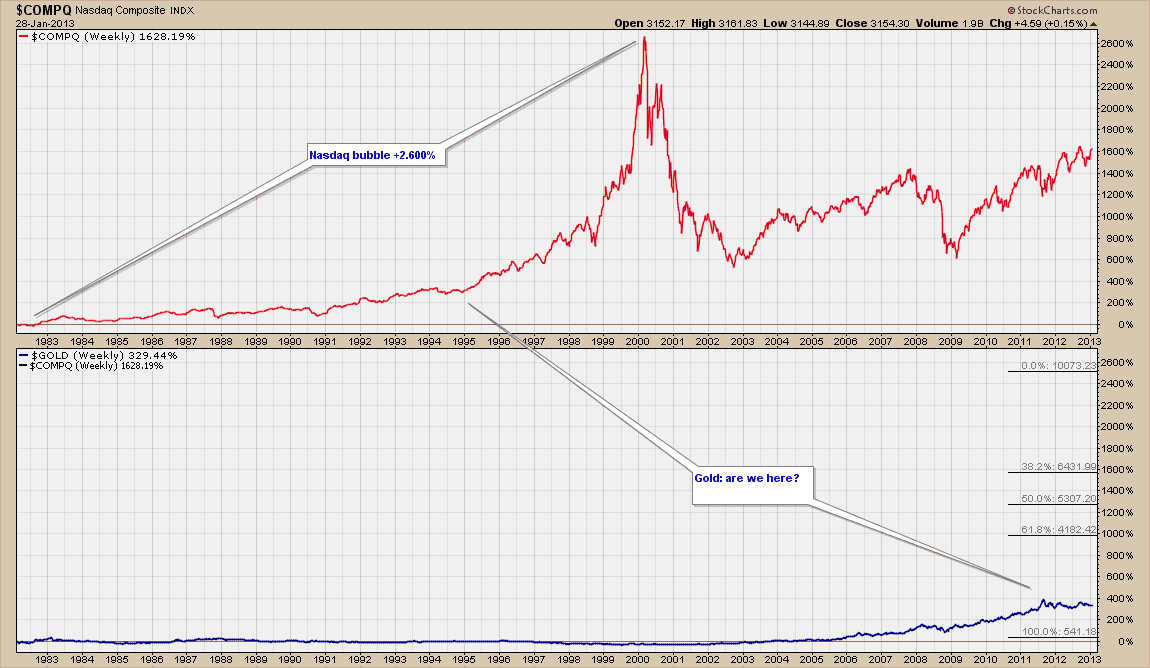
Source: Simone Alberizzi
Simone Alberizzi shows in his chart that for Gold to mimic the Nasdaq euphoric of the late 1990s, it would have to reach over $10,000 per ounce. Considering this historical data, we can see that during the secular stock bull market of 1982-2000, Nasdaq managed to achieve a return of 26 times its value. Also consider that during the 1970s and into January of 1980, Gold also managed to return more than 23 times its value. When one compares those astronomical moves to the current bull market, hopefully we all come to a conclusion that we still have a long way to go.
Chart 8: Silver has under performed in the last two years…
Source: Objective Trader / Simone Alberizzi / Short Side of Long
While realising Precious Metal fundamental conditions continue to improve and assets like Gold are likely not anywhere close to the bubble stage, I once again turn my attention back to the shorter term time frame. In particular I favour playing the Silver triangle right here and will consider entering long if and when the price breaks from its current formation.
While already stated many times on this blog, as a long term investor, I still see a lot of value in Silver. Consider the fact that the price peaked on 25th of April 2011 at almost $50. The correction has been ongoing for more than 1 year & 9 months, and with the price still trading 37% below its all time high, purchasing at current levels definitely falls under the investors rule book of “buying low” and hopefully in some years from now “selling high”.
Chart 9: … and still remains inexpensive when adjusted for CPI
Source: Macro Trends
Just to return to its nominal value of $50 per ounce, last seen in January 1980 and April 2011, Silver would have to rally almost 60% from the current levels. That in itself would be an amazing return, but the true value of this speculative metal lays with its possibility to re-test its inflation adjusted highs of January 1980. For that to occur, Silver will have to enter a mania and most likely clock a triple digit handle.


