Time to Trade Stocks and Silver for Gold?
Market professionals and experienced investors consider it to be common knowledge that silver has more real-world uses than its precious metal sister gold. Silver is used in coins, photography, batteries, bearings, electronics, and mirrors. Silver also aids in numerous medical applications and even contributes to helping capture and use solar energy. The Silver Institute describes “silver uses” as follows:
Demand for silver is built on three main pillars: industrial and decorative uses, photography, and jewelry & silverware. Together, these three categories represent more than 95 percent of annual silver consumption. In 2007, 455.5 million ounces of silver were used for industrial applications, while over 128 million ounces of silver were committed to the photographic sector, 163.4 million ounces were consumed in the jewelry market, and 58.8 million ounces were used in the silverware market.
Why is this indispensable metal in such demand? The reasons are simple. Silver has a number of unique properties including its strength, malleability and ductility, its electrical and thermal conductivity, its sensitivity to and high reflectance of light and the ability to endure extreme temperature ranges. Silver’s unique properties restrict its substitution in most applications.
While gold is used in numerous consumer products, such as in computers and electronics, according to geology.com about 78% of the gold consumed each year is used in the manufacture of jewelry. Investors also respect the use of gold as an alternative to paper currencies and as a safe haven asset.
The point is silver tends to be in greater demand relative to gold during economic expansions and bull markets. Gold tends to be in greater demand when concerns rise about economic downturns or geopolitical events. These basic investment tenants describe how stock investors can benefit from monitoring the gold/silver ratio, which is simply a study of the demand for gold relative to the demand for silver. Before looking at how the gold/silver ratio can help us better understand the threat of an ongoing correction in stocks, we will review recent historical cases that illustrate swings in relative demand for these precious metals.
According to a February 28 story in The Daily Reckoning:
The US Mint sold over 6.4 million silver Eagles in January, more than any other month since the coin’s introduction in 1986. China’s net imports of silver quadrupled in 2010, to 122.6 million ounces, roughly 13.7% of global production. Meanwhile, mine production can’t meet worldwide demand; the only way demand gets fulfilled is from scrap supply.
On March 10 we showed how defensive assets, such as the VIX and utilities, were gaining strength relative to the stock market. Just as the changes in relative strength can help us better understand a possible shift in market sentiment, the gold/silver ratio could be termed the “defensive/expansion ratio”. When investors are playing defense, the ratio rises since gold is in favor relative to silver. When investors are less concerned with Armageddon-like events and more focused on better economic times, the ratio falls since silver is in favor relative to gold.
In terms of where the economy sits right now, the Fed opened its March 15 statement with an upbeat tone:
Information received since the Federal Open Market Committee met in January suggests that the economic recovery is on a firmer footing, and overall conditions in the labor market appear to be improving gradually. Household spending and business investment in equipment and software continue to expand.
On March 15 we looked at the performance of numerous asset classes and market sectors under two scenarios – during the April-August 2010 ‘flash crash’ correction and during the subsequent QE2-induced rally off the August 2010 lows. Today we dig a little deeper into the data to help us better understand the risk of another prolonged correction occurring in the coming months. The table below shows how investments related to precious metals performed during a defensive/corrective period (left) and during a period where economic expansion/inflation-friendly assets were in favor (right). Investments related to precious metals are highlighted in green. Gold is represented by the gold ETF (GLD). Silver is represented by the silver ETF (SLV).

Just as we would have guessed, gold outperformed silver during the ‘flash crash’ correction by a margin of almost 2-to-1. Similarly, when market participants became less fearful and began to focus on economic growth and QE2, silver significantly outperformed gold in late 2010 and year-to-date.
The question of the day is:
What are silver and gold telling us now and how does it potentially impact the stock market?
The chart below shows a bullish turn in the gold/silver ratio that was “confirmed” by a higher high on April 27, 2010. Think of April 27 as a bullish turn in the defensive/expansion ratio, meaning defensive-minded investors overtook bullish investors in terms of their conviction.
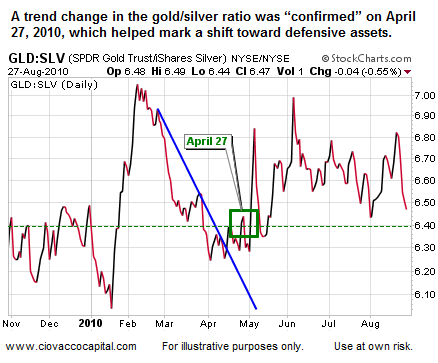
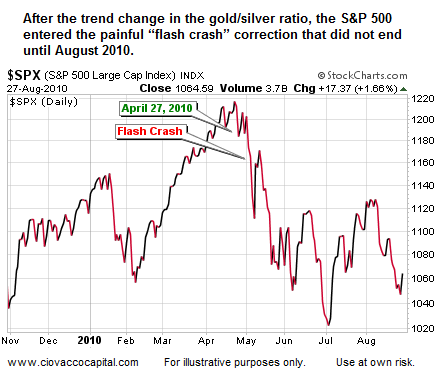
As shown below, the stock market did not perform well after the bullish turn in the gold/silver ratio. Compare April 27 in the chart above to April 27 in the chart below.
The good news is the present day gold/silver ratio is not telling us to swap our silver and stocks for gold; at least not yet. The gold/silver ratio remains in a downtrend (pink line), which means the conviction of gold buyers has not yet surpassed the conviction of silver buyers. Said another way, the conviction of defensive-minded investors has not yet surpassed the conviction of economic bulls.
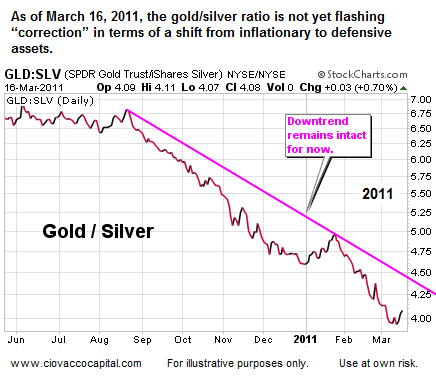
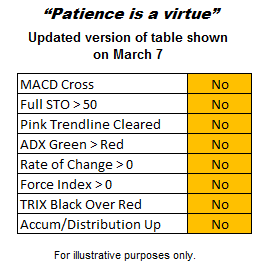
Three things need to happen from a technical perspective for gold to gain the upper hand on silver. The first one, breaking above the pink trendline, has not even occurred yet. It may indeed happen in short order, but for now the gold/silver ratio is terming the current state of the stock market as a “pullback”. It may indeed upgrade the classification to a “correction”, but relative to the events of 2010 we have not even met that standard yet.
In terms of our investment strategy, this analysis does not alleviate our concerns about Japan and the fast-approaching completion date for QE2. As we stated yesterday, this remains a ‘prove it to me’ market, meaning we have been and are open to raising more cash using the incremental approach. On Wednesday, we cut back further on gold stocks (GDX), Australia (EWA), Germany (EWG), and inverse-Treasury bonds (TBT). The current state of the gold/silver ratio does leave us open to better than expected outcomes over the next few weeks. Our short-term bull/bear checklist, based on the S&P 500, remains in the “be patient” range.
The CCM 80-20 Correction Index is telling us to remain defensive, but to also keep an open mind relative to where stocks may be in three-to-six months. In the tables below, high numbers indicate more favorable conditions in terms of historical risk vs. reward.
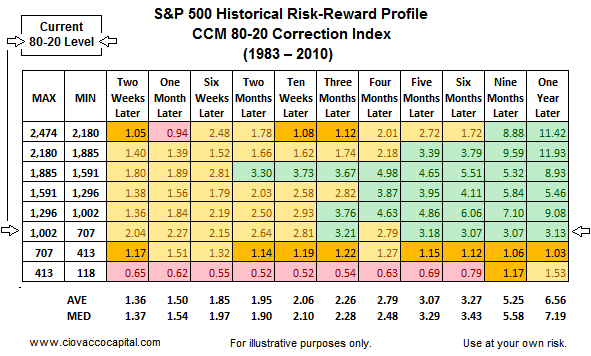
The figures in the tables are as of Wednesday’s market close. Notice the current risk reward numbers (top of table below in yellow and green) and are attractive relative to the market’s average and median profiles under various conditions.
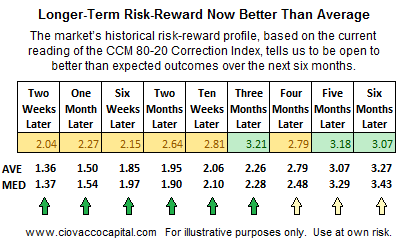
The market’s current profile, from a positive perspective, means little unless we see evidence starting to accumulate which points to a probable change in the short-term trend. Said another way, until we see evidence to the contrary, we need to maintain a defensive bias. Once the evidence begins to shift, we have to look at the market objectively to make the best allocation decisions possible.


