Use Gold Technicals To Build Core Positions Now
Gold Bullion. 6 Month Price Chart
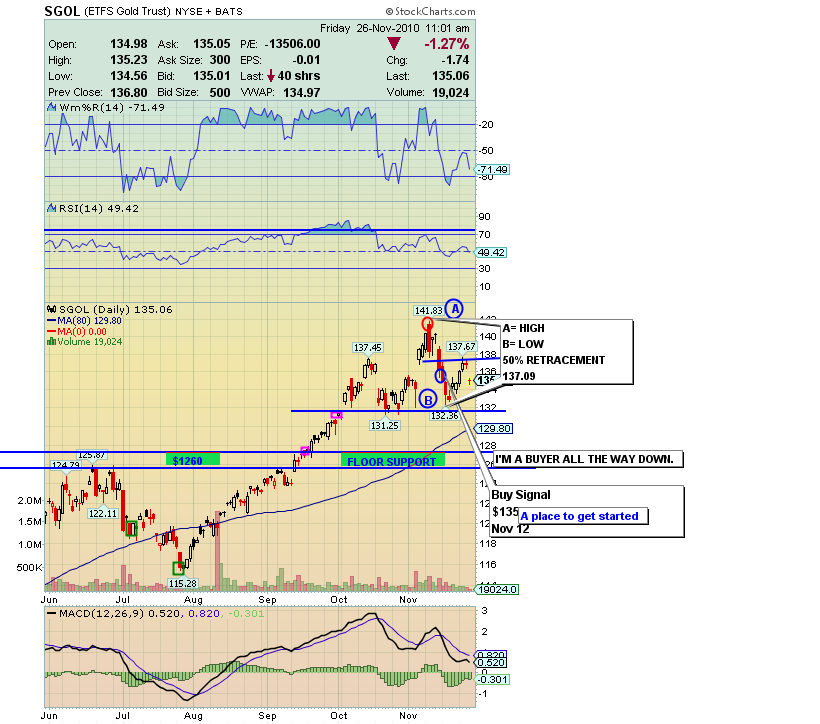
Super Force Gold Bullion Analysis:
- Gold has a Super Force Buy Signal as of Friday Nov. 12th on SGOL at $135.41 and $131.70 is also a buy. Sell at $141.73.
- Bullion equivalent buy price: $1354. Nov. 12
Bullion sell price: $1417.
Bullion buy price: $1317.
- I see Gold going remarkably higher over the next several months and years. Any investor who is light on Gold (under 30% precious metal assets) should begin accumulating now, and buy much heavier if Gold goes lower.
- As I examine the precious metal sector, I see some key developments that stand to open further buying opportunities.
- The first development I see is a continued impressive move in the US dollar. The dollar, over many years, will continue to lose its value. Over the course of the next several months, I see the USD making a move higher. That doesn’t necessarily mean Gold has to “tank”, but it will likely, at least, pause the move in this sector.
- SFS subscribers have taken full advantage of current weakness in the Precious metals sector, particularly last week, as price was slammed lower. Those of you who tried out my free alerts offer got in on those buys! This week I offered faster profit booking for you with the higher velocity trades of my newest SF60 Service .
- The second development I want draw to your attention is the 50% retracement of the November decline. I’m referring to the $136.50 price area. Note the detail of this area on the six month chart above. When prices correct, they never go in a straight line. We have seen the initial decline followed by a bounce, that bounce has brought price to the 50% retracement line in Gold and Gold stocks.
- The third area correlates with the above point. As price has rebounded, note the heaviest volume, sorry to say, is to the downside.
- I expect more downside price action in the coming weeks.
- All that weakness must be bought now. I see this as a great opportunity. Use my charts to lay in capital for long term holding and trading positions.
- I have marked on the 6 month chart an area of initial support followed by an area entitled Floor Support. Listen carefully to my words here: The initial support has already held, followed by a bounce. I believe price will break that initial support. My Super Force Floor Support is the $1260 gold price area.
- It is vital to understand that any corrective action is a process. If you understand the process, you can make additional money by taking advantage of the correction. Why? Because Gold is going much higher!
Gold Bullion. One Year Price Chart
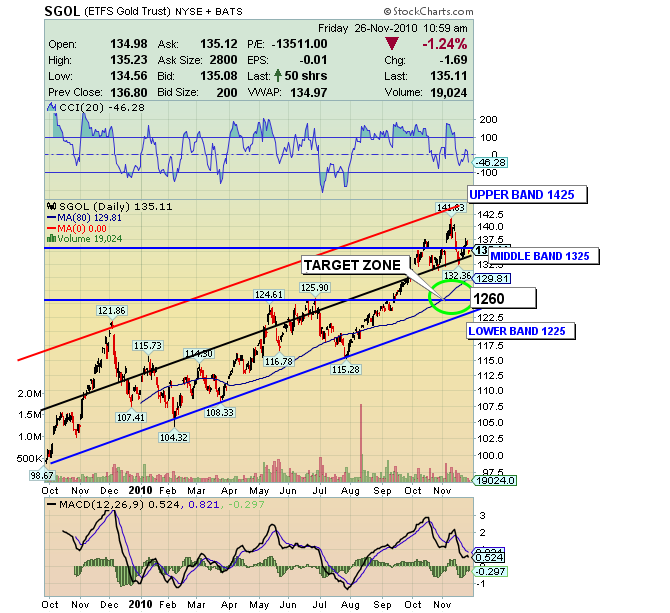
- Here is the longer term daily chart. This particular chart was key in the ability of the Superforce team to successfully identify the previous 1425 peak.
- The only sensible way to play a correction is to buy as price goes lower. It is a total mistake to wait, target a price where you think the correction might end, and end up missing this great opportunity here now.
- Let me close the commentary of this section the way I started it. Gold will be remarkably higher.
Gold Juniors – GDXJ Chart.
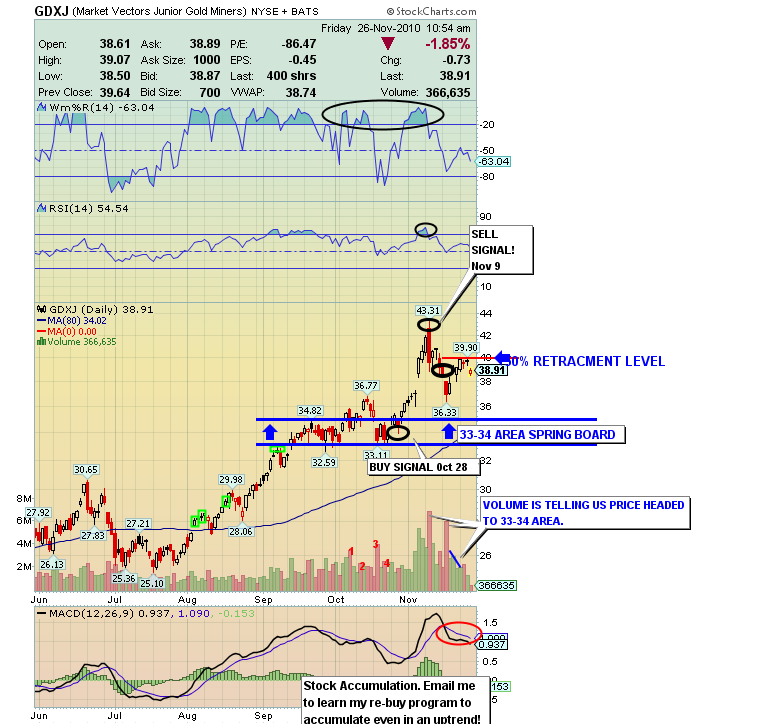
Super Force Gold Juniors Analysis.
- I issued a sell signal to book solid profits on Tuesday, Nov. 9, at $42.18. I then issued a Super Force Buy Signal on GDXJ on Friday Nov.12. That’s just 3 days later. This market is starting to move! Your buy price was $38.74.
- After gains of 24% in just a couple of weeks on GDXJ, this signal, from Sell to Buy, saved you another 8.1%. These numbers of size come from the increase in market volatility. They are not going away, and are more likely to increase!
- The current GDXJ rally is a counter trend move in what appears to be intermediate corrective action. Note the 50% retracement line on the one year chart!
- The volume story over the past week on GDXJ is absolutely critical to understanding what is happening. GDXJ has been the leader in the gold sector. Studying volume bores most technicians. It is all-critical and points to further corrective action into the GDXJ 33-34 price area. I’m buying all the way down.
- I created my SF60 Trading System to manage exactly this kind of volatility, and that volatility is growing. I don’t guess what’s going to happen or “wing it”. I take all the signals, all of them, myself.
- Why trade Gold Stocks if they are going much higher? Why not just hold all the positions for the long term? I trade Gold stock recommendations using my 60 minute chart proprietary indicators for two reasons.
- 1) I have successfully traded GDX and GDXJ in these markets. Each time lowering my average share cost basis, and enlarging my core. That is what the shorter term trading is all about. My core is already 30% larger than it was in early summer, and yet my cash levels are higher. The market, not me, paid for that increase in my long term core positions.
- 2) Trade something you have confidence in. Start with gold. If you have no confidence in gold, how can you have confidence in anything in the market? You can’t. My rule is to book wins, not losses! If that is your philosophy on trading then you want to trade items that have the highest probably on going higher over both the short and long term. Buy well. Sell better.
GDX- 9 Month Chart
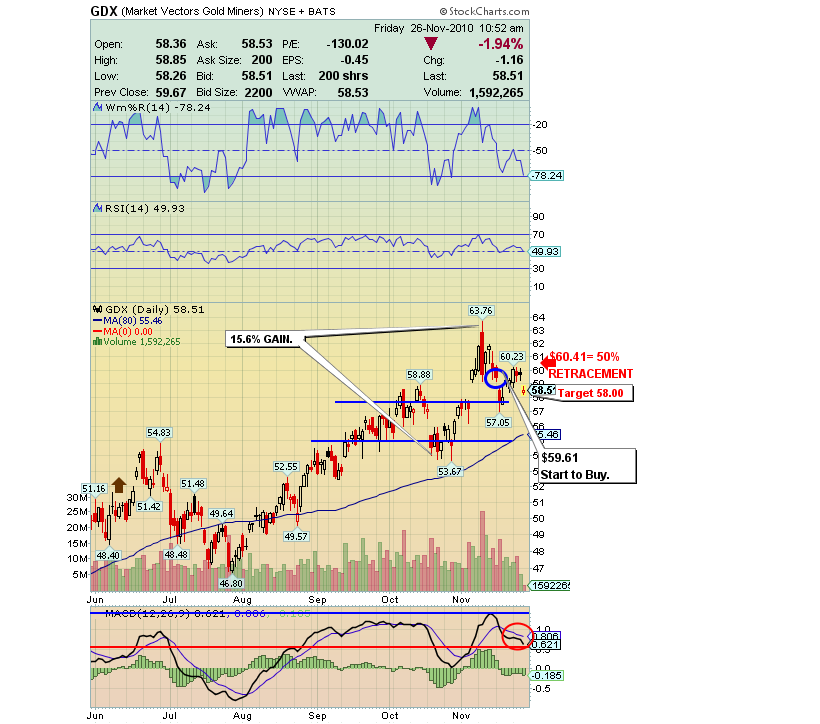
GDX. Massive Breakout On 3 Year Chart
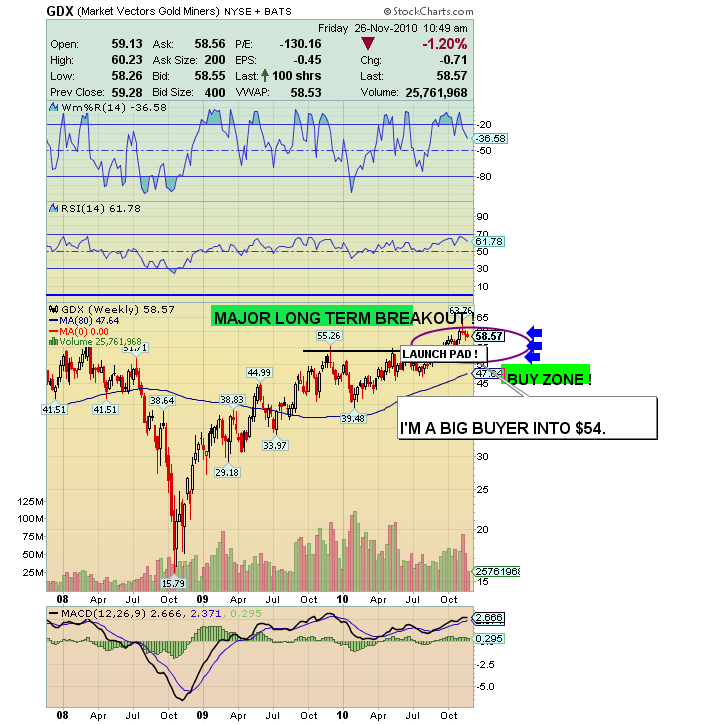
Super Force Gold Stocks Analysis:
- My Super Force GDX Buy Signal was issued on Oct 19th for GDX at $54.26.
- I then gave you the GDX Sell Signal Nov 9th at $62.73.
- My Super Force Buy Signal on Nov 12th at $59.61 gave you substantial savings. 5.0% savings from the sell to the re-buy.
- The most important fact in the investment world now, is to understand correctly, just how far the Gold Stocks are, behind Gold itself. GDX is trailing Gold by over 40% since late 2008. Gold is up substantially and the chart shows zero progress for GDX, which is why you need to focus on buying it now.
- It’s also very important to remember there is not enough gold. There are no Ben Bernanke electronic printing presses for gold. The only way to get more Gold is to mine it! Fiat Currency is credit, not money. You can’t print money. You have to mine it!
- The above facts underscore why the juniors (GDXJ) are in great demand, demand that may increase beyond even some of your imaginations.
- Sorry to those who had hoped for a parabolic move before Christmas, but I believe we are in a corrective phase that could take up to two months to unfold. In this Bull Market, it would be unwise to try to time your buys at the bottom, at the end of the correction. Gold Stocks are dramatically undervalued because of the 2008 meltdown. As you can see on the above chart, I will help you buy into this correction systematically.
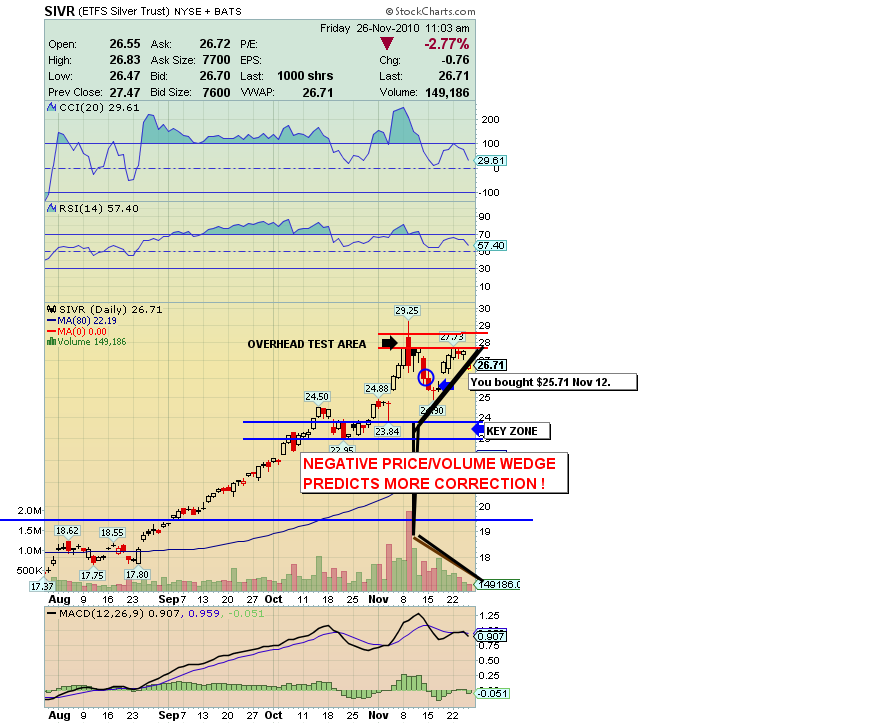
Silver Chart
-
I issued a Buy Signal Nov. 12th on SIVR at $25.71.
-
As you know, Silver is an asset that I hold a large core position in, and is likely going much higher in the long term. I added to positions of physical silver, locked in on the spot market at $25.00, which is the low for the correction, so far.
-
A look at my silver chart identifies the key buying zone you need to focus on. The silver market rallied 68% from July to its peak, hit this month. This key zone is the 50% retracement of the correction to date.
- What is of more importance, particularly for those who don’t have any allocation to silver at all, is to buy any further weakness. As far as whether price goes back to $25 silver, or even lower, my key indicators suggest it could happen, and I want you to be prepared to buy into such an event. There are warnings developing on my charts. In particular, my Price Volume Wedge Indicator is flashing a significant warning. Systematically, I want to see everyone in the gold community buy into this correction!
My SuperForce Proprietary Surge Signals:
25 Surge Index Buy or 25 Surge Index Sell: Solid Power.
50 Surge Index Buy or 50 Surge Index Sell: Stronger Power.
75 Surge Index Buy or 75 Surge Index Sell: Maximum Power.
100 Surge Index Buy or 100 Surge Index Sell: “Over The Top” Power!
Stay alert for my signals, sent by email to subscribers, for both the daily charts on Super Force Signals at www.superforcesignals.com and for the 60 minute charts at www.superforce60.com
About Super Force Signals:
Our Surge Index Signals are created thru our proprietary blend of the highest quality technical analysis and many years of successful business building. We are two business owners with excellent synergy. We understand risk and reward. Our subscribers are generally successful business owners, people like yourself with speculative funds, looking for serious management of your risk and reward in the market.
Frank Johnson: Executive Editor, Macro Risk Manager.
Morris Hubbartt: Chief Market Analyst, Trading Risk Specialist.
Email:
trading@superforcesignals.com
trading@superforce60.com


