Very Bullish Long-Term Outlook for Silver Stocks
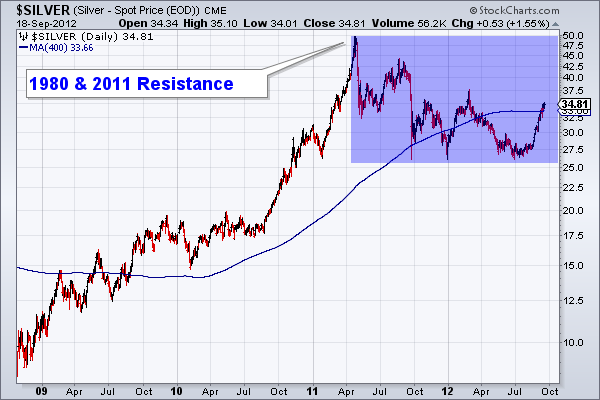
While we have written about Silver here and there, we have not covered it publicly in over a year. The market made an obvious cyclical top last spring and the tremendous gains from late 2008 into 2011 would need to be corrected and digested. From May to July the market tested its lows successfully and formed support. The recent advance confirmed the lows and confirms that we are likely in a new cyclical bull market. Based on the technicals, Silver and silver stocks continue to show tremendous long-term potential.
Below is a chart of our growth producer index which features 10 growth-oriented producers and is weighted somewhat by market capitalization. The market had a rip-roaring advance which lasted a total of 27 months. The correction lasted about 14 months (a 50% time retracement) and retraced about 50% in price. As you can see from the circles, the low occurred in May and was retested multiple times over the summer.

The long-term technical outlook for silver producers is potentially nothing short of super bullish. We say potentially because nothing is certain in this business. The market has formed a textbook cup and handle pattern. Note that the beginning of the handle is higher than the start of the cup. In other words, this shows more strength than a typical pattern in which those two points are equal or in which the start of the handle is lower than the start of the cup.

Moreover, we can visually see that the correction in a long-term sense was relatively mild. Mathematically speaking it was dramatic (about 50% in percentage terms) but much less dramatic than 2007-2008 (90%) and less dramatic than 2004 (60%). A smaller correction can be a sign of a market building internal strength for the next impulsive advance.
The super bullish outcome would be driven by Silver making a run at and eventually surpassing $50/oz. The equities are closer to their all-time highs and will likely break to new highs before Silver clears $50/oz. Certainly, the “super bullish outcome” is predicated on Silver breaking through $50/oz.
We know a few things. First, we are in a new cyclical bull market. Second, we are moving closer to the beginning of the bubble phase in this bull market. Third, in a bull move, Silver acts like Gold on steroids. It’s clear from the charts that Silver and silver stocks are in position for a potentially spectacular move over the next three to five years. We believe that the silver stocks can break to new highs in the next 12 months and that Silver won’t be far behind. The bubble phase is certainly several years away but these charts illustrate the potential for massive breakouts which would generate the momentum that leads into a bubble.
In the meantime, Silver and the silver stocks have rebounded strongly. Similar to the gold stocks, we see an upcoming pause or pullback in silver stocks over the next month. October is typically a weak month. Many stocks have rebounded substantially and with strong momentum. A pause or correction in October stands between gold and silver miners and a retest of old highs in the winter. A correction would also mark a great buying opportunity ahead of much higher prices. If you’d be interested in professional guidance in uncovering the producers and explorers poised to outperform then we invite you to learn more about our service.
Good Luck!
Jordan Roy-Byrne, CMT
Jordan@TheDailyGold.com