Which Assets will Benefit from QE3?
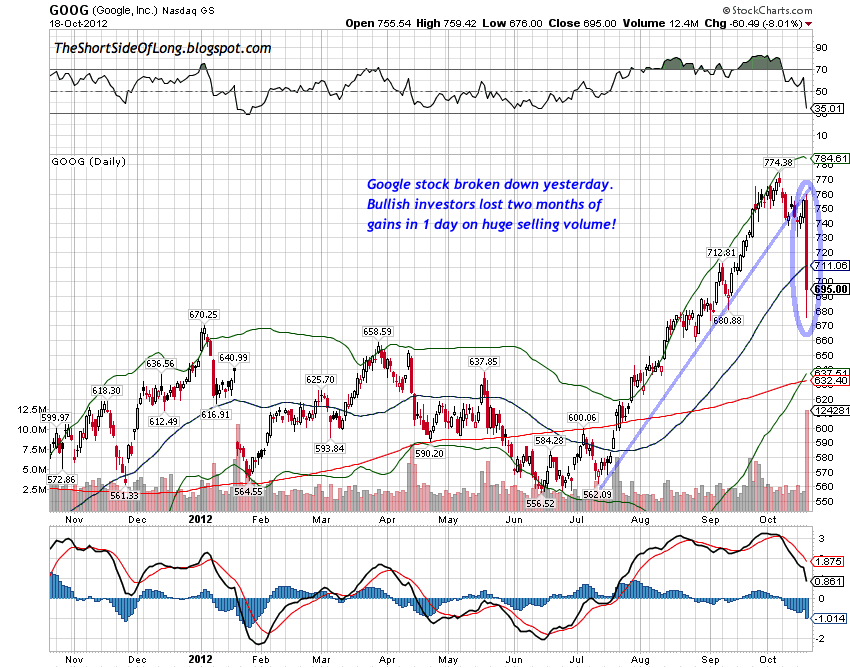
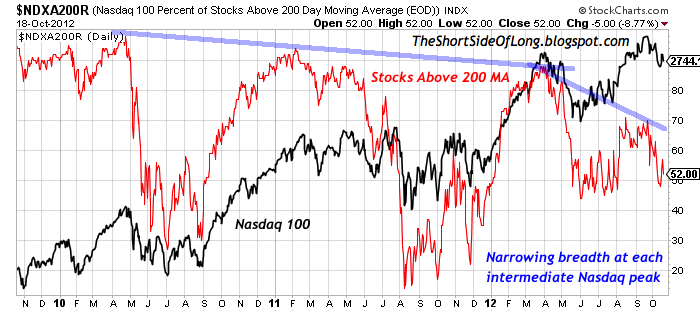
- Equity market internals continue to deteriorate, especially in the Technology sector, which transitionally has had leading characteristics. Last night we saw that Google broke down due to disappointment in revenues and earnings. Other major components that have been struggling as of late include all the big names like Apple, Microsoft, IBM, Intel, Amazon, AMD, HP, Dell and many others. Percentage of stocks within the Nasdaq 100 index that are above 50 MA stand at 42%, while those above 200 MA stand at 52%. Breadth has been narrowing at each intermediate peak, which is a major warning signal that the bull market end is very close. Furthermore, the economically sensitive Semiconductor sector has now broken below its 200 day MA once again.
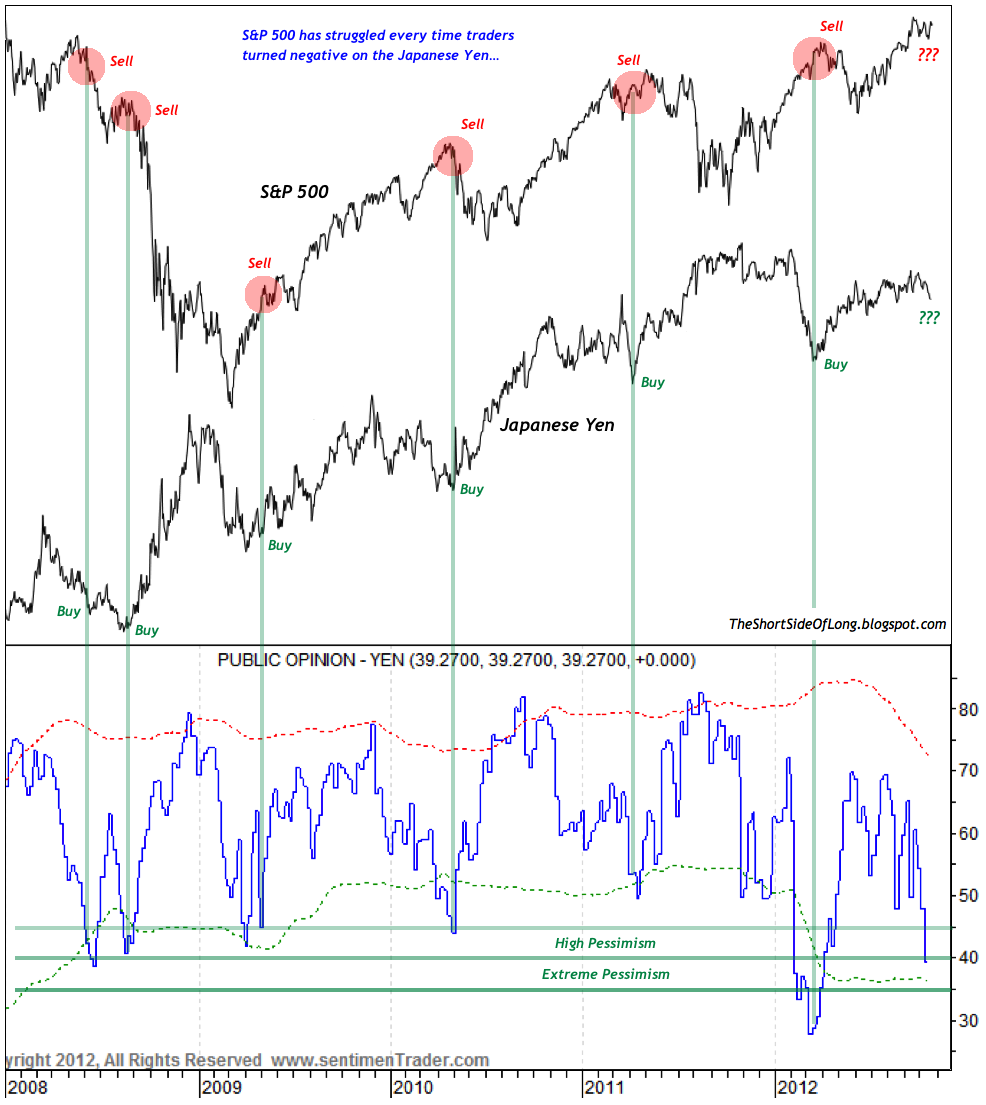
- If it wasn’t already bad enough that economic growth was at stall speed; margin & revenue conditions are starting to deteriorate; also volatility & sentiment is at very complacent levels, stock market investors have another headwind to deal with. Various sentiment surveys on safe haven currencies like the US Dollar (not shown here) and Japanese Yen (chart above) show high levels of pessimism. Historically, S&P 500 has struggled every time traders and investors turned negative on the Japanese Yen. Will this time be different? Disclosure: I’ve purchased long dated OTM calls on the Yen.
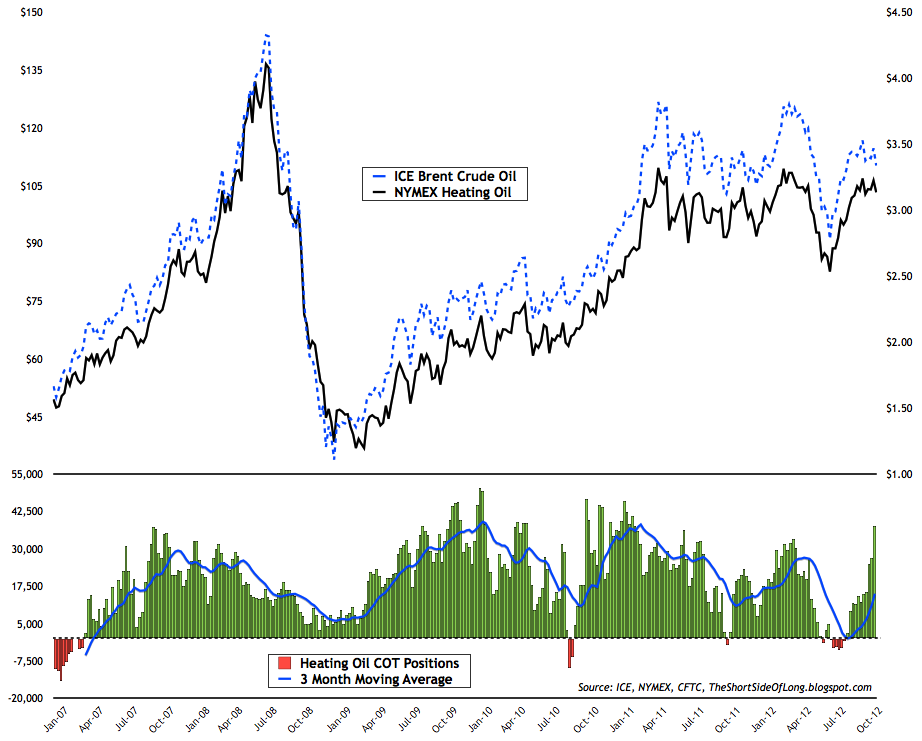
- Nymex heating Oil prices tend to hold a very close correlation relationship with North Sea Ice Brent Crude Oil prices. Therefore, it does make sense to track hedge fund positioning in the Heating Oil market to try and determine the confidence of investors. The chart above shows that hedge funds betting on energy, extended their bullish bets to the highest level since the February 2011 (Libyan Crisis), just as Heating Oil and Brent Crude were topping. Even more importantly, small speculative COT positions (not shown here), which tend to be known as Dumb Money, have now risen to the highest bullish level in at least a decade. Only a few weeks ago, I was warning about excessive speculation in the Nymex West Texas Crude Oil market. Price has lost over 10% since then.

- If the Facebook Mania IPO wasn’t enough of a signal that we are at the top of the bull market, consider the following. It has come to my attention that a plan to construct the world’s tallest building will take place in China next year. Furthermore London is planning to construct Western Europe’s tallest building around the same time. Those not familiar with the curse of skyscrapers and business cycles, should give it a read here. Basically, research has shown that the “world’s tallest buildings have risen on the eve of economic downturns. Business cycles and skyscraper construction correlate in such a way that investment in skyscrapers peaks when cyclical growth is exhausted and the economy is ready for recession.”
Before I continue, I’d like to say, I am not picking out certain investors for the sake of them being right or wrong. This is capitalism so it is not about who made what call, but instead it is about the money / profit / gain. Personal money is always in question and some of the time even other people’s money is also in question, therefore what I am always trying to teach my readers is basically to either be a contrarian or end up being a casualty.
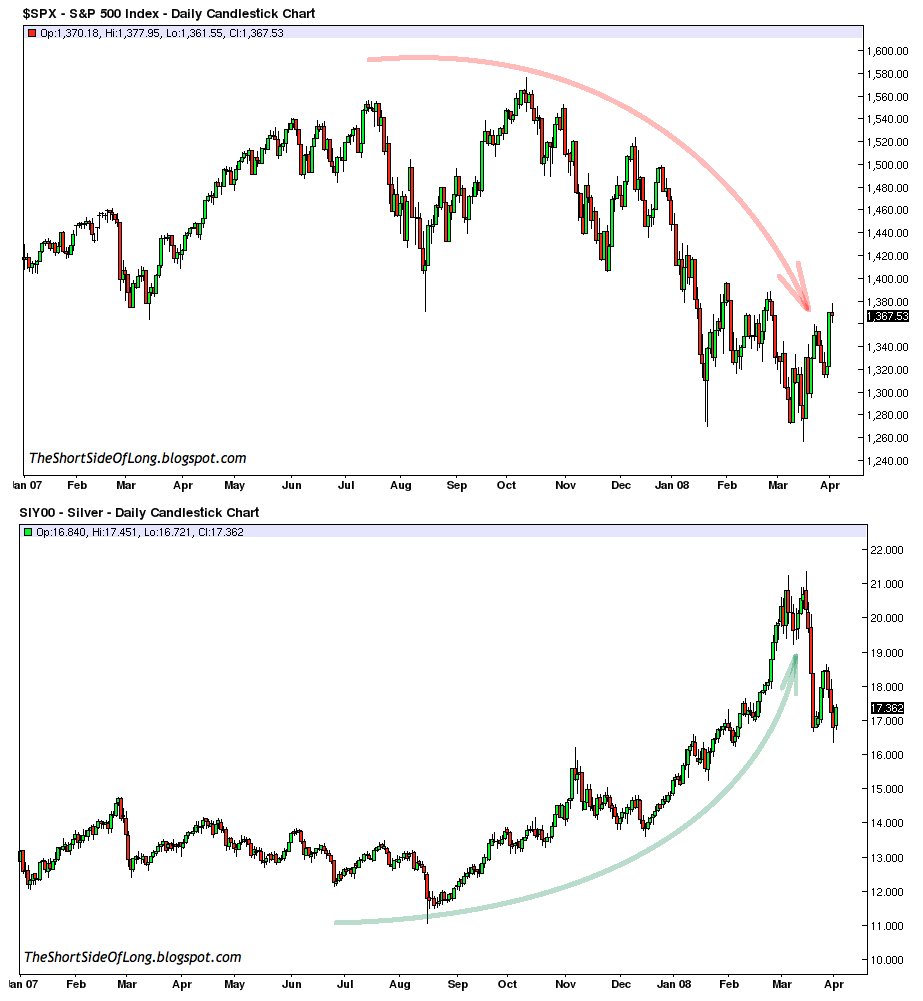
Regardless of whether something is in a bullish or bearish trend, following consensus and not doing any of your own thinking is usually a good way to go broke, very quickly. Remember, when you see a lot of people drawing vertical upside arrows for any asset, like in those six examples or hundreds of others seen throughout the internet during late September and early October, it is usually a signal that something completely opposite will happen.


- sentiment surveys falling below neutrality (currently too high)
- hedge fund reducing futures positioning (currently on high side)
- market open interest speculation declining (rose too rapidly)
- retail crowd hot money leaving ETFs (currently too high)
- increase in ETFs short interest ratio activity (currently too low)
- large Put purchase levels relative to Calls (currently too low)
Finally, a major buy signal would be to see some of the consensus bloggers and technical analysts, who were predicting $1900 Gold as recently as a few weeks ago, to start doubting Gold’s uptrend because their Elliot Wave counts, cycle frameworks and various technical indicators break down rapidly.
As I have been saying all along, it is my view that certain risk assets like Precious Metals and Agriculture will benefit much more from Fed’s QE, while other risk assets like stocks might not benefit at all. So therefore stay patient, stay alert and stay a contrarian. Remember that when it’s obvious to the public, it is obviously wrong.
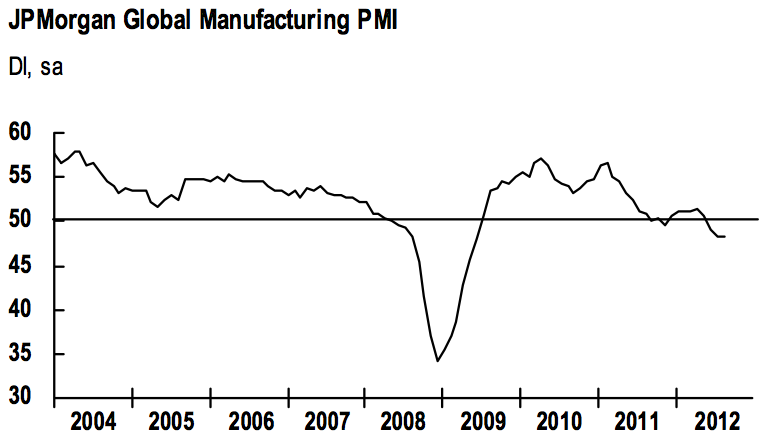
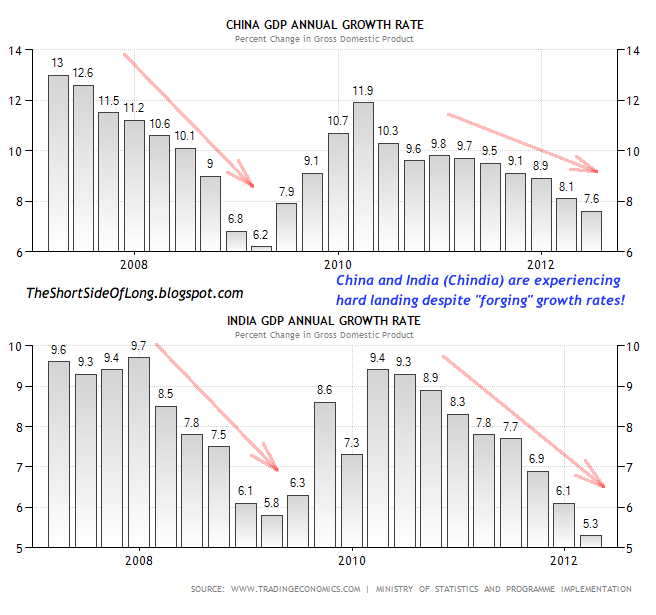
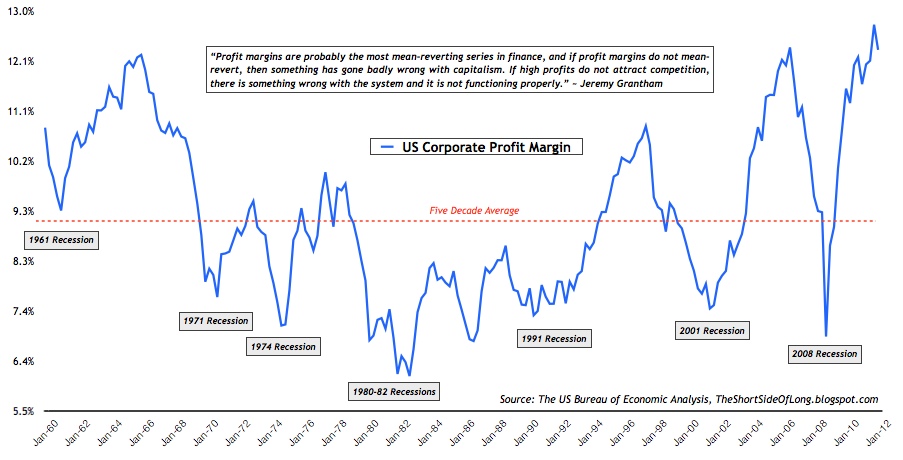
- Outlook: The Global economy continues to slow rapidly towards a recession. The United States GDP has grown below 2% for 5 out of the last 6 quarters. German GDP is also at stall speed, while China & India are slowing meaningfully with an increasing risk of a hard landing. US corporate earnings and gross profit margins are at record highs, so mean reversion is likely. Corporate revenue growth is already slowing.
- Important Indicators: Cash levels within mutual funds, retail investors, hedge funds and money market funds are at extreme lows, volatility is at very complacent levels and credit spreads are very narrow relative to fundamentals. We are witnessing bubble-like record fund inflows into Junk Bond market, a very dangerous signal.
- Long Positioning: Long focus is towards the secular commodity bull market, with positions in Precious Metals (weighted heavily towards Silver) and Agriculture. A small individual position in Sugar was recently added. Call options are held on Japanese Yen (long dated OTM).
- Short Positioning: Short focus is towards the secular equity bear market, with positions in Dow Transports, Technology, Discretionary, Industrials and Junk Bonds. Put options are held on Apple, Amazon and recently Salesforce (long dated OTM). Put options are held on Pound and Loonie (long dated OTM).
- Watch-list: A major short in due time will be US Treasury long bonds, as they are extremely overbought and in the midst of a huge bubble. While Grains have exploded, Softs present amazing value for investors. Japanese equities are down about 80% from their all time high over two decades ago and offer great value.


