Research on Central Fund of Canada (CEF), Screams “Buy PM Miners”
I was doing some research on the Central Fund of Canada (ticker: CEF), which is a form of “paper” Gold and silver with a long track record and a much better counterparty risk profile than dangerous Gold ETFs like GLD. Now, CEF generally holds about 60% Gold and 40% silver, so it is not a “pure” Gold fund. I don’t recommend paper Gold to anyone before they have established a physical position in Gold as an insurance policy that can always be cashed in when needed. I am not affiliated with nor am I recommending for or against CEF – you must due your own due diligence!
However, I discovered a potentially useful buy and sell signal in the precious metals markets using the premium/discount levels of CEF relative to the Gold price. There is no guarantee this will work in the future, but I found it fascinating and wanted to share it. It seems to actually work best with the silver price, but also works fairly well with Gold and the Gold mining indices.
There are times when CEF trades at a “premium” to the Gold price and times when it trades at a “discount” to the Gold price. When speculative juices and interest in the precious metals patch are running high, a premium tends to develop for silver relative to Gold (and CEF usually only holds around 60% Gold and the other 40% in silver). A lack of speculative interest in the precious metals sector tends to cause the opposite. In a way, then, this is a sort of silver:Gold ratio. However, there is also a component of “froth” or disinterest in the CEF built into this CEF:Gold ratio, as the fund can trade at a premium or discount to the NAV of the underlying metals held by this instrument. Other factors I haven’t considered may also be important. Regardless of why it works, its record is impressive so far in this secular silver and Gold bull market.
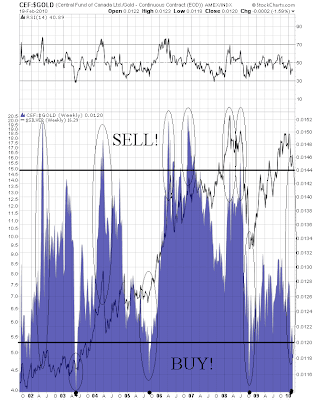
As with most ratio charts or indicators, extreme measurements tend to have the most predictive value. Plotted below is an 8.5 year chart to encompass the entire silver bull market that began in late 2001. The blue area plot is the CEF divided by the Gold price (i.e. CEF:$GOLD ratio chart) and superimposed is a black linear price chart of silver ($SILVER).
And here’s the CEF:$GOLD ratio chart (blue area plot) versus the $XAU Gold mining index (black linear plot) over the same time period:
Will the current signal, which is the 4th strongest of the ongoing secular silver bull market, be proven valid or will it fail here? Those who have read my rants lately know where I stand. I think we’re set for another big bull run and I remain stubbornly bullish here. For more bullish data, look here. The breakout over $1000 was an historic psychological moment in the Gold secular bull market and the new psychological floor for the Gold price is $1000/oz.
People who say that silver has been lagging and thus the current Gold bull move is suspect don’t understand silver at all and should be ignored. Silver makes big, fast moves at the end of a precious metals run and can play catch up quickly – VERY quickly. We haven’t hit the CEF:$GOLD ratio levels that have ended previous big moves in silver or Gold. I think we will before this bull thrust completes.
After a breakout following an 18 month consolidation at and below the $1000/oz level, a 3 month rally of 20% in the Gold price ain’t enough of a run. There’s more to come in my opinion before a significant longer-term correction will occur. I predict new highs in Gold, Gold mining indices and silver before the spring is over. All surprises should be to the upside in the precious metals patch. Of course, I am all in on precious metals and mining shares from the long side and thus as biased as possible…
[ad#WSCS Ad#2]


